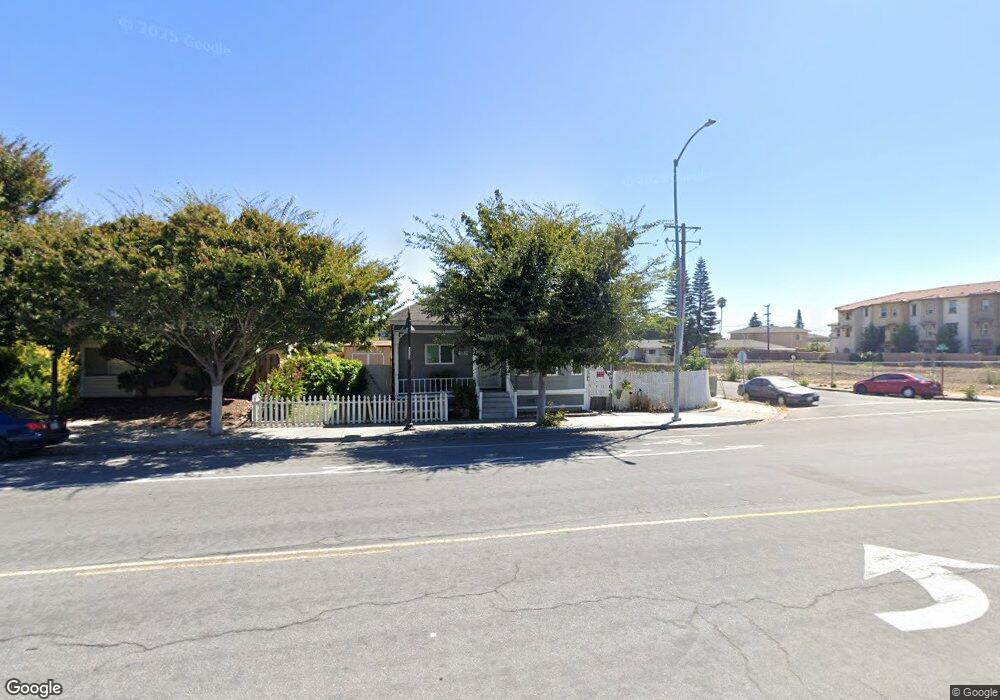
4132 Central Ave Fremont, CA 94536
Glenmoor NeighborhoodEstimated Value: $922,000 - $1,126,500
3
Beds
2
Baths
927
Sq Ft
$1,135/Sq Ft
Est. Value
About This Home
This home is located at 4132 Central Ave, Fremont, CA 94536 and is currently estimated at $1,051,875, approximately $1,134 per square foot. 4132 Central Ave is a home located in Alameda County with nearby schools including Glenmoor Elementary School, Centerville Junior High School, and Washington High School.
Ownership History
Date
Name
Owned For
Owner Type
Purchase Details
Closed on
Sep 23, 2019
Sold by
Garcia John and Cedillo Robert
Bought by
Barrido Maria Felnie and Barrido Rodolfo
Current Estimated Value
Home Financials for this Owner
Home Financials are based on the most recent Mortgage that was taken out on this home.
Original Mortgage
$630,900
Outstanding Balance
$552,619
Interest Rate
3.6%
Mortgage Type
New Conventional
Estimated Equity
$499,256
Purchase Details
Closed on
Sep 4, 2019
Sold by
Garda John Percy and Garda Mary H
Bought by
Garda Mary H and Garda John Percy
Home Financials for this Owner
Home Financials are based on the most recent Mortgage that was taken out on this home.
Original Mortgage
$630,900
Outstanding Balance
$552,619
Interest Rate
3.6%
Mortgage Type
New Conventional
Estimated Equity
$499,256
Purchase Details
Closed on
Feb 25, 1994
Sold by
Gutierrez Luis T and Gutierrez Yolanda
Bought by
Garcia John Percy and Garcia Mary H
Create a Home Valuation Report for This Property
The Home Valuation Report is an in-depth analysis detailing your home's value as well as a comparison with similar homes in the area
Home Values in the Area
Average Home Value in this Area
Purchase History
| Date | Buyer | Sale Price | Title Company |
|---|---|---|---|
| Barrido Maria Felnie | $701,000 | Old Republic Title Company | |
| Garda Mary H | -- | Old Republic Title Company | |
| Garcia John Percy | -- | Fidelity National Title Ins |
Source: Public Records
Mortgage History
| Date | Status | Borrower | Loan Amount |
|---|---|---|---|
| Open | Barrido Maria Felnie | $630,900 |
Source: Public Records
Tax History Compared to Growth
Tax History
| Year | Tax Paid | Tax Assessment Tax Assessment Total Assessment is a certain percentage of the fair market value that is determined by local assessors to be the total taxable value of land and additions on the property. | Land | Improvement |
|---|---|---|---|---|
| 2025 | $9,256 | $759,633 | $464,792 | $301,841 |
| 2024 | $9,256 | $744,604 | $455,680 | $295,924 |
| 2023 | $9,005 | $736,869 | $446,747 | $290,122 |
| 2022 | $8,885 | $715,422 | $437,988 | $284,434 |
| 2021 | $8,667 | $701,262 | $429,403 | $278,859 |
| 2020 | $8,697 | $701,000 | $425,000 | $276,000 |
| 2019 | $3,535 | $255,965 | $137,124 | $118,841 |
| 2018 | $3,463 | $250,947 | $134,436 | $116,511 |
| 2017 | $3,376 | $246,028 | $131,801 | $114,227 |
| 2016 | $3,306 | $241,205 | $129,217 | $111,988 |
| 2015 | $3,251 | $237,583 | $127,277 | $110,306 |
| 2014 | $3,186 | $232,930 | $124,784 | $108,146 |
Source: Public Records
Map
Nearby Homes
- Plan 1629 at Veranda
- Plan 1165 at Veranda
- Plan 1670 at Veranda
- Plan 1455 at Veranda
- Plan 1394 at Veranda
- Plan 1725 at Veranda
- Plan 1378 at Veranda
- Plan 1657 at Veranda
- 3810 Burton Common
- 3833 Burton Common
- 3507 Buttonwood Terrace Unit 203
- 37637 Canterbury St
- 38265 Corrigan Ct
- 3300 Red Cedar Terrace Unit LU25
- 38030 Dundee Common
- 3663 Oakwood Terrace Unit 211
- 3530 Oakwood Terrace Unit 102
- 37621 Glenmoor Dr
- 4586 Norris Rd
- 3371 Baywood Terrace Unit 214
- 4120 Central Ave
- 37642 Argyle Rd
- 4158 Central Ave
- 4104 Central Ave
- 4170 Central Ave
- 4117 Central Ave
- 37654 Argyle Rd
- 4092 Central Ave
- 4192 Central Ave
- 37616 Pimento Common
- 4163 Central Ave
- 4194 Central Ave
- 4091 Central Ave
- 37618 Pimento Common
- 37653 Argyle Rd
- 37581 Maple St
- 4080 Central Ave
- 37666 Argyle Rd
- 4198 Central Ave
- 4085 Central Ave