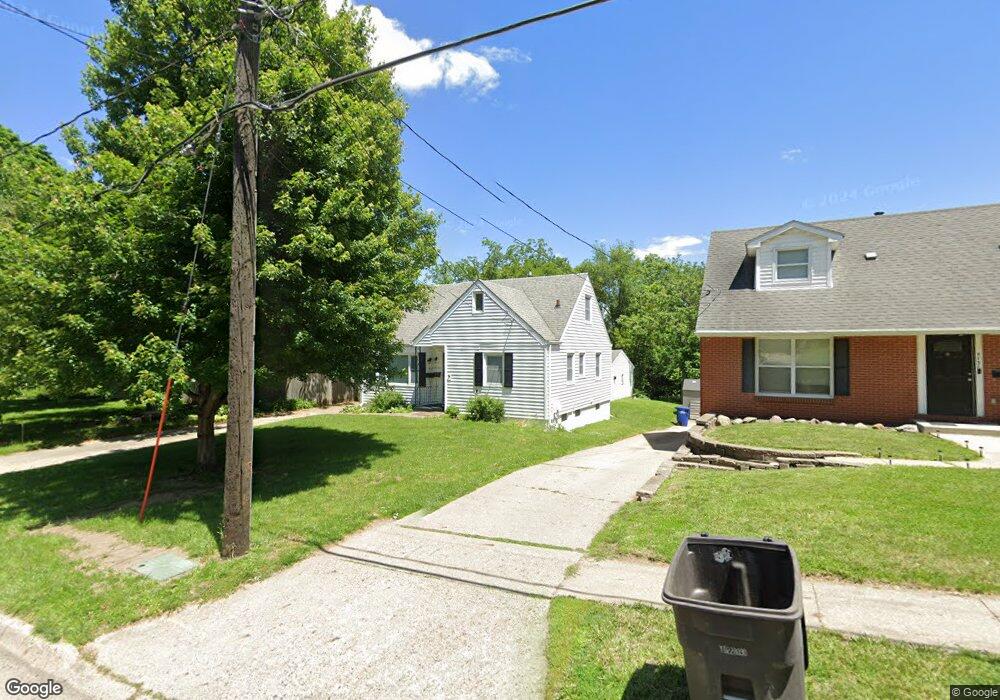
4135 8th St Des Moines, IA 50313
Oak Park NeighborhoodEstimated Value: $180,000 - $198,192
4
Beds
2
Baths
1,828
Sq Ft
$104/Sq Ft
Est. Value
About This Home
This property located at 4135 8th St features 4 bedrooms and 2 bathrooms within a total of 1,828 square feet. The living room offers ample space for relaxation and entertainment, while the bathrooms include both tub and shower options for convenience. Each bedroom provides sufficient room for furnishings and personal space. The property is cable ready and includes a washer and dryer for added convenience. The exterior features a manageable yard, suitable for outdoor activities. The rental price is available upon request. This home is ideal for those seeking a spacious layout with essential amenities.
Ownership History
Date
Name
Owned For
Owner Type
Purchase Details
Closed on
Oct 6, 2023
Sold by
Carrington Jon and Carrington Emily
Bought by
Ejsc Llc
Current Estimated Value
Purchase Details
Closed on
Apr 28, 2023
Sold by
Zeller Marilyn M
Bought by
Carrington Jonathan and Carrington Emily
Home Financials for this Owner
Home Financials are based on the most recent Mortgage that was taken out on this home.
Original Mortgage
$112,500
Interest Rate
6.39%
Mortgage Type
New Conventional
Create a Home Valuation Report for This Property
The Home Valuation Report is an in-depth analysis detailing your home's value as well as a comparison with similar homes in the area
Home Values in the Area
Average Home Value in this Area
Purchase History
| Date | Buyer | Sale Price | Title Company |
|---|---|---|---|
| Ejsc Llc | -- | None Listed On Document | |
| Ejsc Llc | -- | None Listed On Document | |
| Carrington Jonathan | $150,000 | None Listed On Document |
Source: Public Records
Mortgage History
| Date | Status | Borrower | Loan Amount |
|---|---|---|---|
| Previous Owner | Carrington Jonathan | $112,500 |
Source: Public Records
Property History
| Date | Event | Price | List to Sale | Price per Sq Ft |
|---|---|---|---|---|
| 09/03/2025 09/03/25 | Off Market | $2,000 | -- | -- |
| 08/12/2025 08/12/25 | For Rent | $2,000 | 0.0% | -- |
| 06/09/2025 06/09/25 | Off Market | $2,000 | -- | -- |
| 05/06/2025 05/06/25 | For Rent | $2,000 | -- | -- |
Tax History Compared to Growth
Tax History
| Year | Tax Paid | Tax Assessment Tax Assessment Total Assessment is a certain percentage of the fair market value that is determined by local assessors to be the total taxable value of land and additions on the property. | Land | Improvement |
|---|---|---|---|---|
| 2025 | $3,514 | $206,200 | $42,800 | $163,400 |
| 2024 | $3,514 | $178,600 | $36,800 | $141,800 |
| 2023 | $3,494 | $178,600 | $36,800 | $141,800 |
| 2022 | $3,324 | $160,500 | $34,500 | $126,000 |
| 2021 | $3,266 | $160,500 | $34,500 | $126,000 |
| 2020 | $3,404 | $148,200 | $31,700 | $116,500 |
| 2019 | $3,154 | $148,200 | $31,700 | $116,500 |
| 2018 | $3,018 | $129,900 | $27,200 | $102,700 |
| 2017 | $2,672 | $129,900 | $27,200 | $102,700 |
| 2016 | $2,592 | $115,000 | $23,700 | $91,300 |
| 2015 | $2,592 | $115,000 | $23,700 | $91,300 |
| 2014 | $2,684 | $117,500 | $22,700 | $94,800 |
Source: Public Records
Map
Nearby Homes