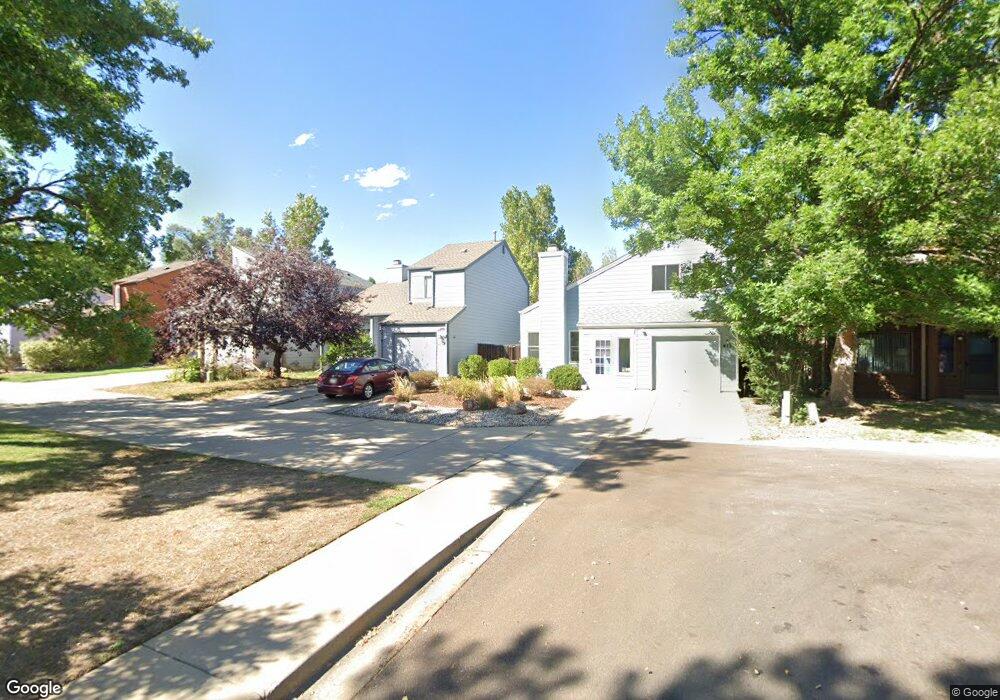
4139 Autumn Ct Boulder, CO 80304
North Boulder NeighborhoodEstimated Value: $794,000 - $856,000
3
Beds
2
Baths
1,346
Sq Ft
$613/Sq Ft
Est. Value
About This Home
This home is located at 4139 Autumn Ct, Boulder, CO 80304 and is currently estimated at $825,423, approximately $613 per square foot. 4139 Autumn Ct is a home located in Boulder County with nearby schools including Crest View Elementary School, Centennial Middle School, and Boulder High School.
Ownership History
Date
Name
Owned For
Owner Type
Purchase Details
Closed on
May 16, 2011
Sold by
Freiberg Harriet
Bought by
Freiberg Janice A
Current Estimated Value
Purchase Details
Closed on
May 15, 1998
Sold by
Renfrow Anne C S
Bought by
Freiberg Bernard M and Freiberg Harriet
Home Financials for this Owner
Home Financials are based on the most recent Mortgage that was taken out on this home.
Original Mortgage
$159,000
Outstanding Balance
$31,284
Interest Rate
7.18%
Estimated Equity
$794,139
Purchase Details
Closed on
Sep 8, 1995
Sold by
Smyth Anne C
Bought by
Renfrow Anne C S
Purchase Details
Closed on
May 15, 1995
Sold by
Peck Susan and Peck Michael
Bought by
Smyth Anne C
Home Financials for this Owner
Home Financials are based on the most recent Mortgage that was taken out on this home.
Original Mortgage
$75,500
Interest Rate
8.36%
Purchase Details
Closed on
Sep 28, 1993
Sold by
Peck Susan Z
Bought by
Peck Susan
Create a Home Valuation Report for This Property
The Home Valuation Report is an in-depth analysis detailing your home's value as well as a comparison with similar homes in the area
Home Values in the Area
Average Home Value in this Area
Purchase History
| Date | Buyer | Sale Price | Title Company |
|---|---|---|---|
| Freiberg Janice A | -- | None Available | |
| Freiberg Bernard M | $184,000 | -- | |
| Renfrow Anne C S | -- | Commonwealth Land Title | |
| Smyth Anne C | $172,000 | Commonwealth Land Title | |
| Peck Susan | -- | -- |
Source: Public Records
Mortgage History
| Date | Status | Borrower | Loan Amount |
|---|---|---|---|
| Open | Freiberg Bernard M | $159,000 | |
| Previous Owner | Smyth Anne C | $75,500 |
Source: Public Records
Tax History Compared to Growth
Tax History
| Year | Tax Paid | Tax Assessment Tax Assessment Total Assessment is a certain percentage of the fair market value that is determined by local assessors to be the total taxable value of land and additions on the property. | Land | Improvement |
|---|---|---|---|---|
| 2025 | $4,129 | $50,113 | $21,644 | $28,469 |
| 2024 | $4,129 | $50,113 | $21,644 | $28,469 |
| 2023 | $4,057 | $53,680 | $22,264 | $35,101 |
| 2022 | $3,313 | $42,624 | $20,099 | $22,525 |
| 2021 | $3,774 | $43,851 | $20,678 | $23,173 |
| 2020 | $3,403 | $39,097 | $20,664 | $18,433 |
| 2019 | $3,351 | $39,097 | $20,664 | $18,433 |
| 2018 | $3,094 | $35,690 | $18,432 | $17,258 |
| 2017 | $2,998 | $39,458 | $20,378 | $19,080 |
| 2016 | $2,966 | $34,260 | $17,353 | $16,907 |
| 2015 | $2,808 | $27,207 | $10,348 | $16,859 |
| 2014 | $2,288 | $27,207 | $10,348 | $16,859 |
Source: Public Records
Map
Nearby Homes
- 4143 Sunrise Ct
- 2770 Arbor Glen Place
- 2558 Premier Place
- 2512 Premier Place
- 2362 Spotswood Place
- 2528 Pampas Ct
- 3895 Norwood Ct
- 3805 Northbrook Dr Unit A
- 2158 Tamarack Ave
- 3850 Paseo Del Prado St Unit 4
- 3788 26th St
- 3807 Paseo Del Prado St
- 4258 Corriente Place Unit D3
- 2170 Vine Ave
- 2672 Winding Trail Dr
- 2736 Winding Trail Dr
- 2125 Vine Ave
- 3737 26th St
- 4251 Peach Way
- 1952 Vine Ave