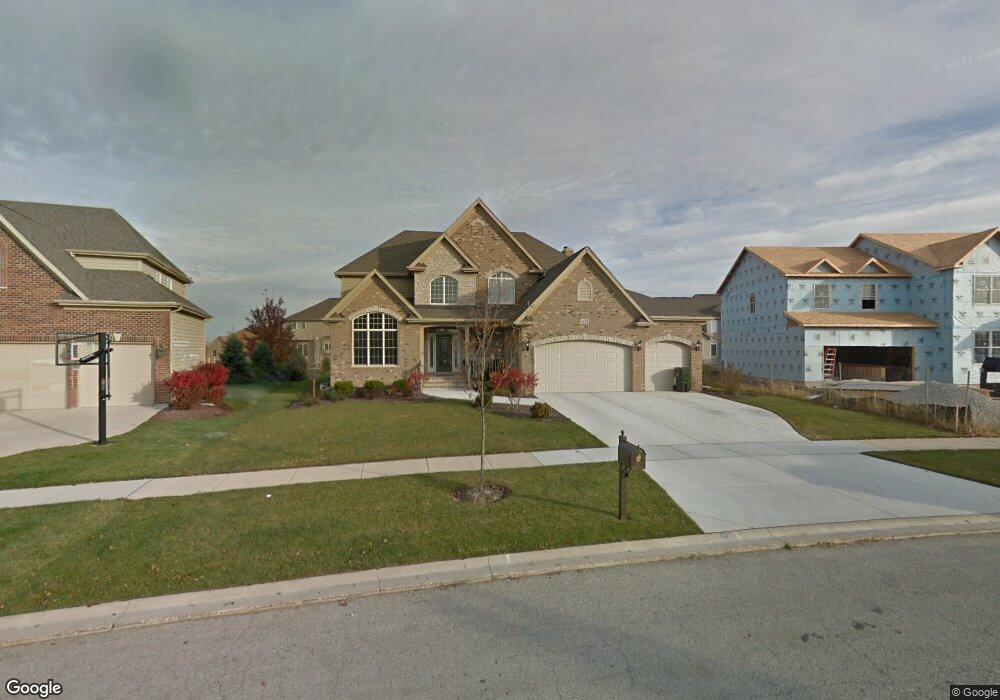
4139 Callery Rd Naperville, IL 60564
North Plainfield NeighborhoodEstimated Value: $929,068 - $972,000
Studio
1
Bath
3,783
Sq Ft
$253/Sq Ft
Est. Value
About This Home
This home is located at 4139 Callery Rd, Naperville, IL 60564 and is currently estimated at $955,267, approximately $252 per square foot. 4139 Callery Rd is a home located in Will County with nearby schools including Danielle-Joy Peterson Elementary School, Clifford Crone Middle School, and Neuqua Valley High School.
Ownership History
Date
Name
Owned For
Owner Type
Purchase Details
Closed on
Feb 19, 2019
Sold by
Walker Bobby and Walker Stephanie Joy
Bought by
Washebeck Bryce R and Washebeck Lesley A
Current Estimated Value
Home Financials for this Owner
Home Financials are based on the most recent Mortgage that was taken out on this home.
Original Mortgage
$466,400
Interest Rate
3.62%
Mortgage Type
New Conventional
Purchase Details
Closed on
May 18, 2012
Sold by
Autumn Homes Inc
Bought by
Walker Bobby
Home Financials for this Owner
Home Financials are based on the most recent Mortgage that was taken out on this home.
Original Mortgage
$411,950
Interest Rate
3.83%
Mortgage Type
New Conventional
Create a Home Valuation Report for This Property
The Home Valuation Report is an in-depth analysis detailing your home's value as well as a comparison with similar homes in the area
Home Values in the Area
Average Home Value in this Area
Purchase History
| Date | Buyer | Sale Price | Title Company |
|---|---|---|---|
| Washebeck Bryce R | $583,000 | Greater Illinois Title Co | |
| Walker Bobby | $550,000 | Chicago Title Insurance Co |
Source: Public Records
Mortgage History
| Date | Status | Borrower | Loan Amount |
|---|---|---|---|
| Previous Owner | Washebeck Bryce R | $466,400 | |
| Previous Owner | Walker Bobby | $411,950 |
Source: Public Records
Tax History
| Year | Tax Paid | Tax Assessment Tax Assessment Total Assessment is a certain percentage of the fair market value that is determined by local assessors to be the total taxable value of land and additions on the property. | Land | Improvement |
|---|---|---|---|---|
| 2024 | $15,011 | $237,174 | $52,703 | $184,471 |
| 2023 | $15,011 | $209,517 | $46,557 | $162,960 |
| 2022 | $15,968 | $226,392 | $44,042 | $182,350 |
| 2021 | $15,268 | $215,612 | $41,945 | $173,667 |
| 2020 | $14,980 | $212,195 | $41,280 | $170,915 |
| 2019 | $14,727 | $206,215 | $40,117 | $166,098 |
| 2018 | $14,550 | $200,228 | $39,234 | $160,994 |
| 2017 | $14,331 | $195,059 | $38,221 | $156,838 |
| 2016 | $14,307 | $190,860 | $37,398 | $153,462 |
| 2015 | $14,648 | $183,520 | $35,960 | $147,560 |
| 2014 | $14,648 | $181,150 | $35,960 | $145,190 |
| 2013 | $14,648 | $181,150 | $35,960 | $145,190 |
Source: Public Records
Map
Nearby Homes
- 4128 Callery Rd
- 4023 Juneberry Rd
- 4304 Champion Rd
- 5332 Cedar Dr
- 11616 Century Cir
- 11640 Century Cir
- 11724 Glenn Cir Unit 4D
- 4207 Carpenter Rd
- 11405 Glenbrook Cir
- 3915 Royal Portrush Dr
- 3712 Ryder Ct
- 24944 Franklin Ln Unit 131
- 0 W 119th St
- 11300 Highland Dr S
- 3907 Littlestone Cir
- 11330 Highland Dr S
- 11920 Winterberry Ln
- 3372 Fulshear Cir
- 3371 Fulshear Cir
- 3373 Fulshear Cir
- 4139 Callery Rd
- 4143 Callery Rd
- 4135 Callery Rd
- 4048 Juneberry Rd
- 4052 Juneberry Rd
- 4147 Callery Rd Unit 1
- 4044 Juneberry Rd
- 4131 Callery Rd
- 4056 Juneberry Rd
- 4144 Callery Rd
- 4040 Juneberry Rd
- 4136 Callery Rd
- 4151 Callery Rd
- 4127 Callery Rd
- 4132 Callery Rd
- 4148 Callery Rd Unit 1
- 4060 Juneberry Rd
- 4142 Callery Rd
- Lot 61 Callery Rd
- Lot 63 Callery Rd
Your Personal Tour Guide
Ask me questions while you tour the home.