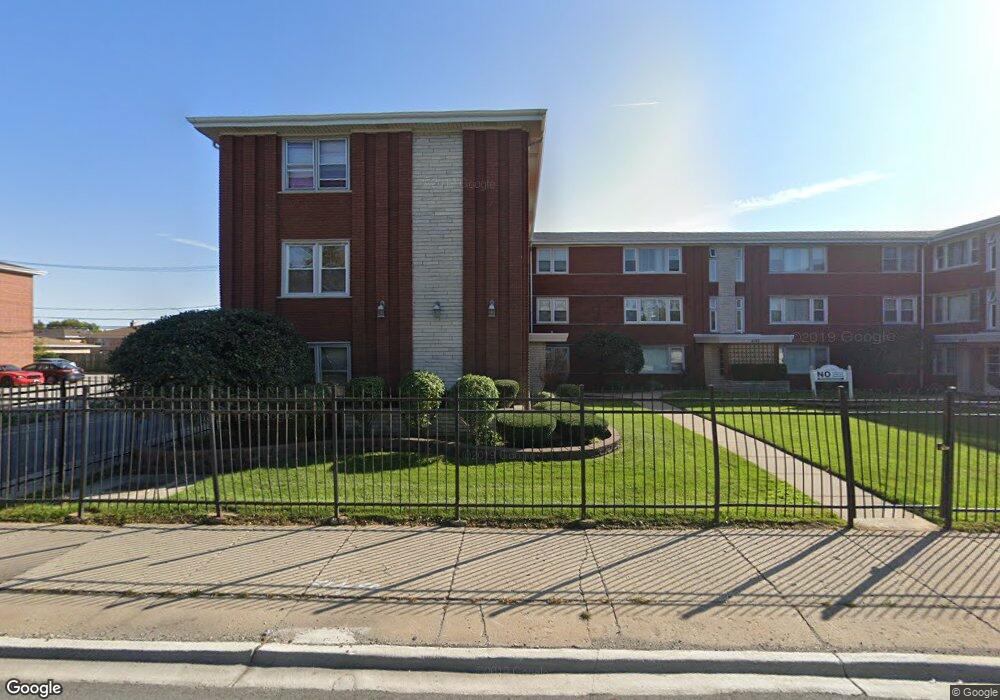
4139 W 79th St Unit 41393N Chicago, IL 60652
Scottsdale NeighborhoodEstimated Value: $114,229 - $144,000
2
Beds
1
Bath
900
Sq Ft
$141/Sq Ft
Est. Value
About This Home
This home is located at 4139 W 79th St Unit 41393N, Chicago, IL 60652 and is currently estimated at $126,807, approximately $140 per square foot. 4139 W 79th St Unit 41393N is a home located in Cook County with nearby schools including Stevenson Elementary School, Bogan Computer Technical High School, and St Bede-Venerable School.
Ownership History
Date
Name
Owned For
Owner Type
Purchase Details
Closed on
Mar 30, 2018
Sold by
Moran Marcos
Bought by
Yanez Johanna
Current Estimated Value
Home Financials for this Owner
Home Financials are based on the most recent Mortgage that was taken out on this home.
Original Mortgage
$51,200
Outstanding Balance
$44,214
Interest Rate
4.62%
Mortgage Type
New Conventional
Estimated Equity
$82,593
Purchase Details
Closed on
Jun 6, 2017
Sold by
Sotelo Minerva
Bought by
Moran Marcos
Purchase Details
Closed on
Mar 22, 1999
Sold by
First Midwest Trust Company Natl Assn
Bought by
Sotelo Minerva
Home Financials for this Owner
Home Financials are based on the most recent Mortgage that was taken out on this home.
Original Mortgage
$63,400
Interest Rate
6.85%
Mortgage Type
FHA
Create a Home Valuation Report for This Property
The Home Valuation Report is an in-depth analysis detailing your home's value as well as a comparison with similar homes in the area
Home Values in the Area
Average Home Value in this Area
Purchase History
| Date | Buyer | Sale Price | Title Company |
|---|---|---|---|
| Yanez Johanna | $55,500 | Fidelity National Title | |
| Moran Marcos | $34,000 | None Available | |
| Sotelo Minerva | $67,000 | -- |
Source: Public Records
Mortgage History
| Date | Status | Borrower | Loan Amount |
|---|---|---|---|
| Open | Yanez Johanna | $51,200 | |
| Previous Owner | Sotelo Minerva | $63,400 |
Source: Public Records
Tax History Compared to Growth
Tax History
| Year | Tax Paid | Tax Assessment Tax Assessment Total Assessment is a certain percentage of the fair market value that is determined by local assessors to be the total taxable value of land and additions on the property. | Land | Improvement |
|---|---|---|---|---|
| 2024 | $949 | $10,904 | $936 | $9,968 |
| 2023 | $925 | $4,500 | $1,325 | $3,175 |
| 2022 | $925 | $4,500 | $1,325 | $3,175 |
| 2021 | $905 | $4,499 | $1,325 | $3,174 |
| 2020 | $1,213 | $5,443 | $1,325 | $4,118 |
| 2019 | $1,224 | $6,090 | $1,325 | $4,765 |
| 2018 | $1,203 | $6,090 | $1,325 | $4,765 |
| 2017 | $519 | $5,787 | $1,169 | $4,618 |
| 2016 | $659 | $5,787 | $1,169 | $4,618 |
| 2015 | $580 | $5,787 | $1,169 | $4,618 |
| 2014 | $1,250 | $9,307 | $1,091 | $8,216 |
| 2013 | $1,214 | $9,307 | $1,091 | $8,216 |
Source: Public Records
Map
Nearby Homes
- 7964 S Tripp Ave
- 7932 S Pulaski Rd Unit 301
- 8100 S Kildare Ave
- 7917 S Kostner Ave
- 4263 W 81st St
- 4222 W 77th St Unit 202
- 4222 W 77th St Unit 204
- 4244 W 77th St Unit 102
- 4327 W 81st St
- 3813 W 78th St
- 4350 W Ford City Dr Unit B1402
- 3928 W 82nd Place
- 8069 S Kolmar Ave
- 7746 S Kolmar Ave
- 7817 S Kenton Ave
- 8132 S Kilbourn Ave
- 8053 S Kenton Ave
- 7958 S Knox Ave
- 3827 W Hayford St
- 8001 S Kilpatrick Ave
- 4139 W 79th St Unit 3N
- 4139 W 79th St Unit 41391N
- 4139 W 79th St Unit 41392S
- 4139 W 79th St Unit 41391S
- 4139 W 79th St Unit 41392N
- 4139 W 79th St Unit 41393S
- 4139 W 79th St Unit 2S
- 4139 W 79th St Unit 1S
- 4139 W 79th St Unit 1N
- 4149 W 79th St Unit 3S
- 4145 W 79th St Unit 41453W
- 4145 W 79th St Unit 41451E
- 4145 W 79th St Unit 41452W
- 4149 W 79th St Unit 41493S
- 4145 W 79th St Unit 41451W
- 4149 W 79th St Unit 41491N
- 4145 W 79th St Unit 41452E
- 4145 W 79th St Unit 41453E
- 4149 W 79th St Unit 41492S
- 4149 W 79th St Unit 41491S