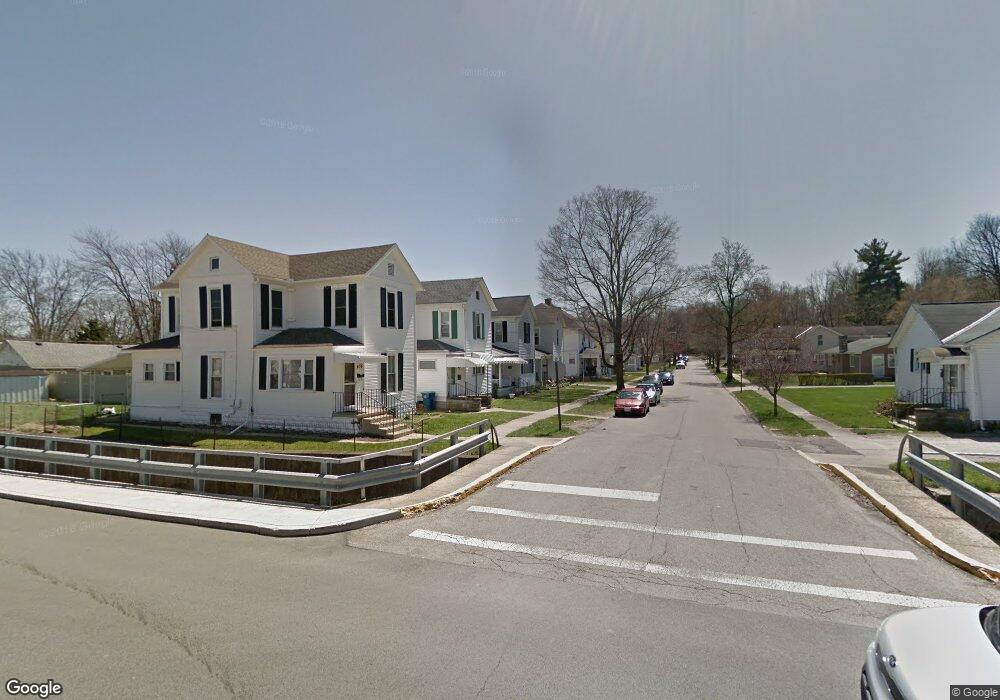
414 Franklin Ave Sidney, OH 45365
Estimated Value: $129,000 - $169,000
3
Beds
2
Baths
1,628
Sq Ft
$87/Sq Ft
Est. Value
About This Home
This home is located at 414 Franklin Ave, Sidney, OH 45365 and is currently estimated at $141,702, approximately $87 per square foot. 414 Franklin Ave is a home located in Shelby County with nearby schools including Sidney High School, Holy Angels Catholic School, and Christian Academy Schools.
Ownership History
Date
Name
Owned For
Owner Type
Purchase Details
Closed on
Dec 9, 2014
Sold by
Secretary Of Veterans Affairs
Bought by
Freund Robert T
Current Estimated Value
Purchase Details
Closed on
Mar 4, 2014
Sold by
Link Thomas W
Bought by
Secretary Of Veterans Affairs
Purchase Details
Closed on
Aug 2, 2006
Sold by
Elsner Joseph W
Bought by
Link Thomas W
Home Financials for this Owner
Home Financials are based on the most recent Mortgage that was taken out on this home.
Original Mortgage
$69,900
Interest Rate
6.2%
Mortgage Type
VA
Purchase Details
Closed on
Aug 29, 1994
Sold by
Elsner Marion L
Bought by
Elsner Joseph W
Home Financials for this Owner
Home Financials are based on the most recent Mortgage that was taken out on this home.
Original Mortgage
$47,500
Interest Rate
8.72%
Mortgage Type
New Conventional
Purchase Details
Closed on
Mar 31, 1994
Create a Home Valuation Report for This Property
The Home Valuation Report is an in-depth analysis detailing your home's value as well as a comparison with similar homes in the area
Home Values in the Area
Average Home Value in this Area
Purchase History
| Date | Buyer | Sale Price | Title Company |
|---|---|---|---|
| Freund Robert T | -- | Attorney | |
| Secretary Of Veterans Affairs | $24,000 | Attorney | |
| Link Thomas W | $69,900 | Chicago Title Insurance Co | |
| Elsner Joseph W | $50,000 | -- | |
| -- | -- | -- |
Source: Public Records
Mortgage History
| Date | Status | Borrower | Loan Amount |
|---|---|---|---|
| Previous Owner | Link Thomas W | $69,900 | |
| Previous Owner | Elsner Joseph W | $47,500 |
Source: Public Records
Tax History
| Year | Tax Paid | Tax Assessment Tax Assessment Total Assessment is a certain percentage of the fair market value that is determined by local assessors to be the total taxable value of land and additions on the property. | Land | Improvement |
|---|---|---|---|---|
| 2024 | $1,053 | $29,690 | $4,650 | $25,040 |
| 2023 | $1,068 | $29,690 | $4,650 | $25,040 |
| 2022 | $886 | $21,590 | $3,450 | $18,140 |
| 2021 | $895 | $21,590 | $3,450 | $18,140 |
| 2020 | $895 | $21,590 | $3,450 | $18,140 |
| 2019 | $785 | $18,730 | $2,920 | $15,810 |
| 2018 | $763 | $18,720 | $2,920 | $15,800 |
| 2017 | $756 | $18,720 | $2,920 | $15,800 |
| 2016 | $662 | $16,360 | $2,920 | $13,440 |
| 2015 | $664 | $16,360 | $2,920 | $13,440 |
| 2014 | $664 | $16,360 | $2,920 | $13,440 |
| 2013 | $677 | $15,400 | $2,920 | $12,480 |
Source: Public Records
Map
Nearby Homes
- 131 Mound St
- 109 E Water St
- 610 Fair Rd
- 518 Rauth St
- 707 Chestnut Ave
- 649 Fair Rd
- 105 N Ohio Ave Unit C
- 107 N Ohio Ave Unit C
- 104 S Pomeroy Ave
- 848 Crescent Dr
- 846 Crescent Dr Unit 848
- 812 Chestnut Ave
- 414 & 416 E Court St
- 230 N Pomeroy Ave
- 300 N Miami Ave
- 1356 Shaggy Bark Dr
- 518 Brooklyn Ave
- 115 Brooklyn Ave
- 917 Mckinley Ave
- 0 Sharp Unit 1043619
- 414 S Franklin
- 408 Franklin Ave
- 404 Franklin Ave
- 418 Franklin Ave
- 402 Franklin Ave
- 422 Franklin Ave
- 403 Franklin Ave
- 426 Franklin Ave
- 417 Franklin Ave
- 207 W Water St
- 330 Franklin Ave
- 425 Franklin Ave
- 502 Franklin Ave
- 402 S Walnut Ave
- 331 Franklin Ave
- 413 S West Ave
- 201 W Water St
- 503 Franklin Ave
- 421 S West Ave
- 508 Franklin Ave
Your Personal Tour Guide
Ask me questions while you tour the home.