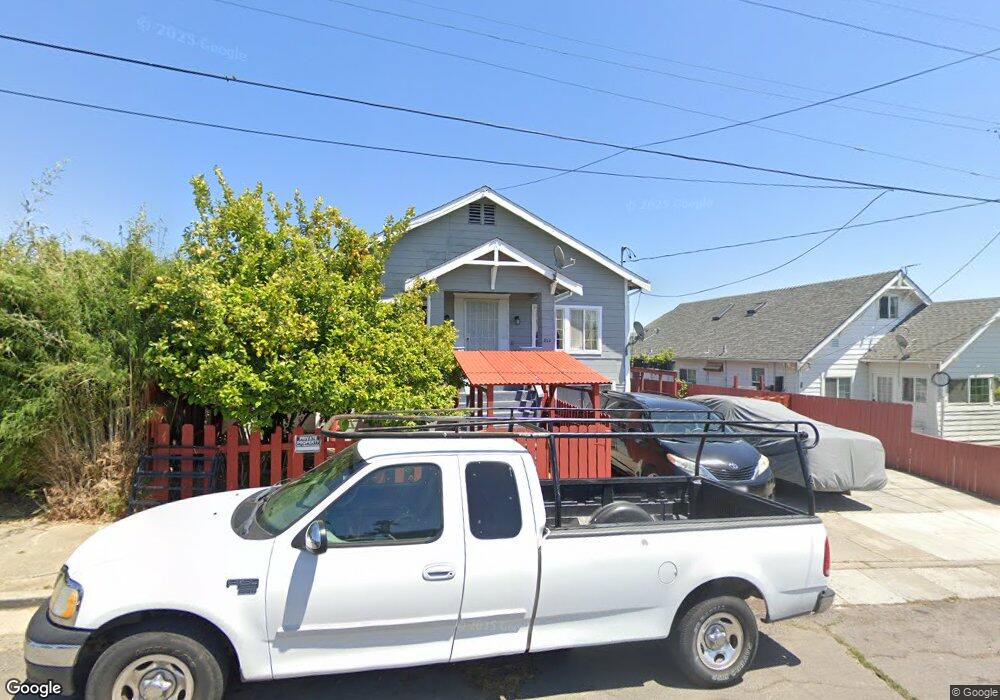
414 Grant St Vallejo, CA 94590
South Vallejo NeighborhoodEstimated Value: $368,000 - $427,000
2
Beds
1
Bath
1,448
Sq Ft
$280/Sq Ft
Est. Value
About This Home
This home is located at 414 Grant St, Vallejo, CA 94590 and is currently estimated at $405,871, approximately $280 per square foot. 414 Grant St is a home located in Solano County with nearby schools including Grace Patterson Elementary School, Vallejo High School, and Mustard Seed Preschool and Kindergarten.
Ownership History
Date
Name
Owned For
Owner Type
Purchase Details
Closed on
Jul 29, 2020
Sold by
Solis Guillermo
Bought by
Solis Guillermo and Solis Guillermo Jr
Current Estimated Value
Purchase Details
Closed on
Jan 4, 2006
Sold by
Solis Guillermo
Bought by
Solis Guillermo
Home Financials for this Owner
Home Financials are based on the most recent Mortgage that was taken out on this home.
Original Mortgage
$250,000
Interest Rate
7.94%
Mortgage Type
Purchase Money Mortgage
Purchase Details
Closed on
Aug 20, 2004
Sold by
Solis Olivia
Bought by
Solis Guillermo
Home Financials for this Owner
Home Financials are based on the most recent Mortgage that was taken out on this home.
Original Mortgage
$209,600
Interest Rate
7.39%
Mortgage Type
New Conventional
Create a Home Valuation Report for This Property
The Home Valuation Report is an in-depth analysis detailing your home's value as well as a comparison with similar homes in the area
Home Values in the Area
Average Home Value in this Area
Purchase History
| Date | Buyer | Sale Price | Title Company |
|---|---|---|---|
| Solis Guillermo | -- | None Available | |
| Solis Guillermo | -- | Fidelity National Title | |
| Solis Guillermo | -- | -- |
Source: Public Records
Mortgage History
| Date | Status | Borrower | Loan Amount |
|---|---|---|---|
| Closed | Solis Guillermo | $250,000 | |
| Closed | Solis Guillermo | $209,600 |
Source: Public Records
Tax History
| Year | Tax Paid | Tax Assessment Tax Assessment Total Assessment is a certain percentage of the fair market value that is determined by local assessors to be the total taxable value of land and additions on the property. | Land | Improvement |
|---|---|---|---|---|
| 2025 | $2,843 | $154,538 | $55,188 | $99,350 |
| 2024 | $2,843 | $151,508 | $54,106 | $97,402 |
| 2023 | $2,643 | $148,539 | $53,046 | $95,493 |
| 2022 | $2,537 | $145,627 | $52,006 | $93,621 |
| 2021 | $2,480 | $142,773 | $50,987 | $91,786 |
| 2020 | $2,391 | $141,310 | $50,465 | $90,845 |
| 2019 | $2,299 | $138,540 | $49,476 | $89,064 |
| 2018 | $2,139 | $135,824 | $48,506 | $87,318 |
| 2017 | $2,025 | $133,161 | $47,555 | $85,606 |
| 2016 | $1,453 | $130,551 | $46,623 | $83,928 |
| 2015 | $1,433 | $128,591 | $45,923 | $82,668 |
| 2014 | $1,652 | $126,073 | $45,024 | $81,049 |
Source: Public Records
Map
Nearby Homes
Your Personal Tour Guide
Ask me questions while you tour the home.