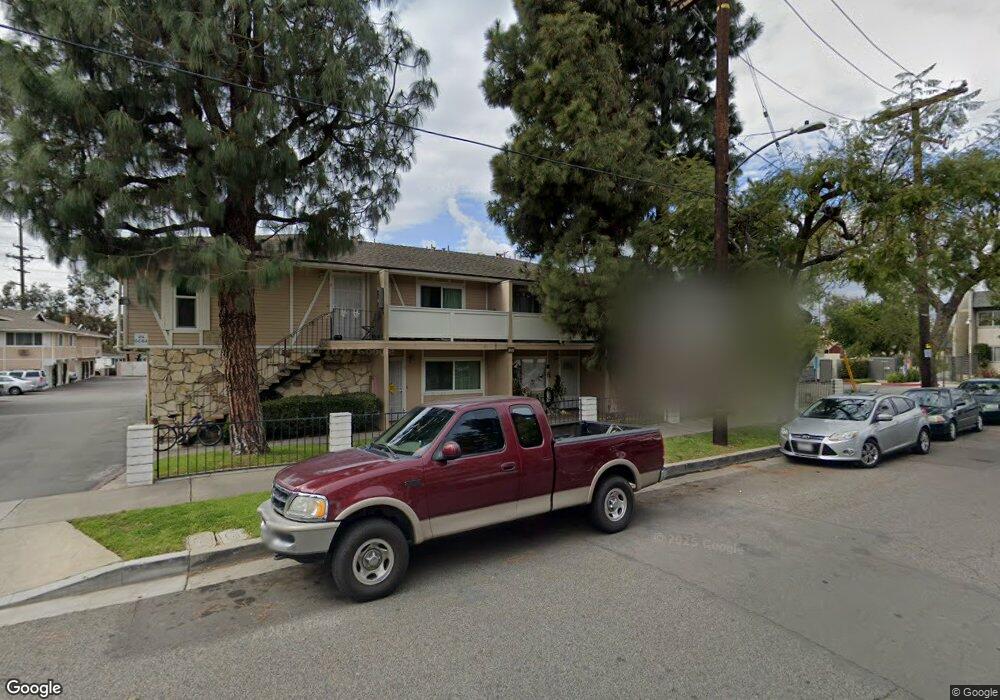
414 N Clark St Unit I Orange, CA 92868
Estimated Value: $545,000 - $715,000
2
Beds
2
Baths
1,095
Sq Ft
$546/Sq Ft
Est. Value
About This Home
This home is located at 414 N Clark St Unit I, Orange, CA 92868 and is currently estimated at $598,024, approximately $546 per square foot. 414 N Clark St Unit I is a home located in Orange County with nearby schools including Sycamore Elementary School, Portola Middle School, and Orange High School.
Ownership History
Date
Name
Owned For
Owner Type
Purchase Details
Closed on
Mar 25, 2025
Sold by
Brown Shamaipornsiripant and Bassett Shamaipornsiripant
Bought by
Shamaipornsiripant Bassett Revocable Living T and Bassett
Current Estimated Value
Purchase Details
Closed on
May 23, 2009
Sold by
Brown Darin
Bought by
Brown Shamaipornsiripant
Purchase Details
Closed on
May 3, 2006
Sold by
Parks John D and Parks Susan M
Bought by
Brown Shamaipornsiripant and Brown Darin
Purchase Details
Closed on
Jan 30, 2004
Sold by
Smith Helen H
Bought by
Parks John D and Parks Susan M
Purchase Details
Closed on
Feb 8, 1995
Sold by
Smith Charles L
Bought by
Smith Helen H
Purchase Details
Closed on
Nov 24, 1993
Sold by
Hamilton Steven Wayne and Hamilton Christina D
Bought by
Smith Charles L
Create a Home Valuation Report for This Property
The Home Valuation Report is an in-depth analysis detailing your home's value as well as a comparison with similar homes in the area
Home Values in the Area
Average Home Value in this Area
Purchase History
| Date | Buyer | Sale Price | Title Company |
|---|---|---|---|
| Shamaipornsiripant Bassett Revocable Living T | -- | None Listed On Document | |
| Brown Shamaipornsiripant | $87,500 | None Available | |
| Brown Shamaipornsiripant | $360,000 | First American Title Co | |
| Parks John D | $245,000 | First American Title Ins Co | |
| Smith Helen H | -- | -- | |
| Smith Charles L | -- | -- |
Source: Public Records
Tax History Compared to Growth
Tax History
| Year | Tax Paid | Tax Assessment Tax Assessment Total Assessment is a certain percentage of the fair market value that is determined by local assessors to be the total taxable value of land and additions on the property. | Land | Improvement |
|---|---|---|---|---|
| 2025 | $4,534 | $407,141 | $318,310 | $88,831 |
| 2024 | $4,534 | $399,158 | $312,068 | $87,090 |
| 2023 | $4,430 | $391,332 | $305,949 | $85,383 |
| 2022 | $4,342 | $383,659 | $299,950 | $83,709 |
| 2021 | $4,222 | $376,137 | $294,069 | $82,068 |
| 2020 | $4,182 | $372,281 | $291,054 | $81,227 |
| 2019 | $4,130 | $364,982 | $285,347 | $79,635 |
| 2018 | $4,066 | $357,826 | $279,752 | $78,074 |
| 2017 | $3,900 | $350,810 | $274,266 | $76,544 |
| 2016 | $3,639 | $326,000 | $257,060 | $68,940 |
| 2015 | $2,787 | $244,000 | $175,060 | $68,940 |
| 2014 | $2,436 | $211,011 | $142,071 | $68,940 |
Source: Public Records
Map
Nearby Homes
- 1029 W Sycamore Ave
- 526 N Emerald Dr
- 264 N Frampton St
- 563 W Maple Ave
- 561 W Maple Ave
- 551 W Maple Ave
- 185 N Batavia St
- 128 N Pixley St Unit A,B,C
- 132 N Jewell Place
- 119 N Little Main St
- 155 S Pepper St
- 321 N Ash St
- 145 W Mayfair Ave
- 246 S Bush St
- 704 W Palmyra Ave
- 148 N Fir St
- 337 E Everett Place
- 225 S Feldner Rd
- 2022 W Spruce Ave
- 280 N Cleveland St
- 414 N Clark St
- 414 N Clark St Unit E
- 414 N Clark St Unit H
- 414 N Clark St Unit B
- 414 N Clark St Unit A
- 414 N Clark St Unit G
- 414 N Clark St Unit F
- 414 N Clark St Unit J
- 414 N Clark St Unit C
- 415 N Clark St Unit D
- 415 N Clark St Unit C
- 415 N Clark St Unit A
- 415 N Clark St Unit B
- 410 N Clark St Unit J
- 410 N Clark St Unit A
- 410 N Clark St Unit I
- 410 N Clark St Unit E
- 410 N Clark St Unit D
- 410 N Clark St Unit F
- 410 N Clark St Unit H