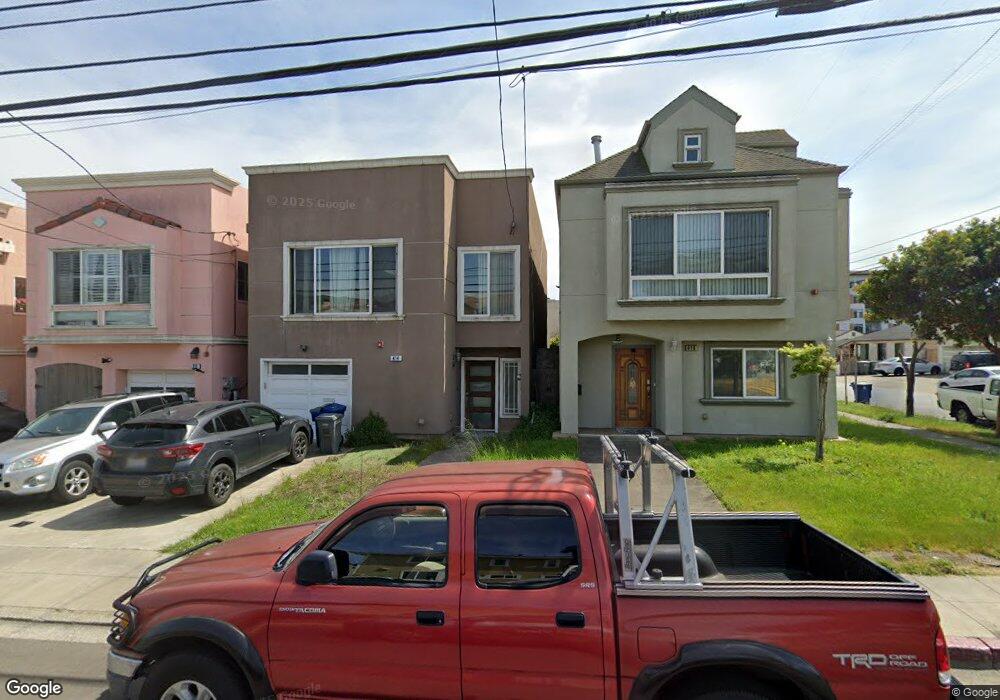
414 W Orange Ave South San Francisco, CA 94080
Orange Park NeighborhoodEstimated Value: $1,067,000 - $1,370,000
3
Beds
4
Baths
1,420
Sq Ft
$863/Sq Ft
Est. Value
About This Home
This home is located at 414 W Orange Ave, South San Francisco, CA 94080 and is currently estimated at $1,225,409, approximately $862 per square foot. 414 W Orange Ave is a home located in San Mateo County with nearby schools including Los Cerritos Elementary School, Alta Loma Middle School, and South San Francisco High School.
Ownership History
Date
Name
Owned For
Owner Type
Purchase Details
Closed on
Jul 23, 2021
Sold by
Liang Yvonne
Bought by
Liang Jennifer and Jennifer Liang Trust
Current Estimated Value
Home Financials for this Owner
Home Financials are based on the most recent Mortgage that was taken out on this home.
Original Mortgage
$548,250
Outstanding Balance
$497,680
Interest Rate
2.93%
Mortgage Type
New Conventional
Estimated Equity
$727,729
Purchase Details
Closed on
Jul 25, 2015
Sold by
Liang Jennifer
Bought by
Liang Jennifer
Purchase Details
Closed on
Jun 3, 2011
Sold by
Liang Yvonne
Bought by
Liang Yvonne and Liang Jennifer
Home Financials for this Owner
Home Financials are based on the most recent Mortgage that was taken out on this home.
Original Mortgage
$417,000
Interest Rate
4.71%
Mortgage Type
New Conventional
Purchase Details
Closed on
Apr 16, 2010
Sold by
Zhou Jian Xiong
Bought by
Liang Yvonne
Purchase Details
Closed on
Sep 5, 2007
Sold by
Wong Simon C and Wong Carol O P
Bought by
Zhou Jian Xiong
Home Financials for this Owner
Home Financials are based on the most recent Mortgage that was taken out on this home.
Original Mortgage
$360,000
Interest Rate
6%
Mortgage Type
Purchase Money Mortgage
Purchase Details
Closed on
Dec 1, 2006
Sold by
Wong Simon C and Wong Carol O P
Bought by
Wong Simon C and Wong Carol O P
Home Financials for this Owner
Home Financials are based on the most recent Mortgage that was taken out on this home.
Original Mortgage
$438,750
Interest Rate
6.38%
Mortgage Type
New Conventional
Purchase Details
Closed on
Apr 9, 2004
Sold by
Wong Simon C and Wong Carol O P
Bought by
Wong Simon C and Wong Carol O P
Home Financials for this Owner
Home Financials are based on the most recent Mortgage that was taken out on this home.
Original Mortgage
$114,900
Interest Rate
4.68%
Mortgage Type
Credit Line Revolving
Purchase Details
Closed on
Mar 1, 2003
Sold by
Kohon Enterprises Inc
Bought by
Wong Simon C and Wong Carol O P
Purchase Details
Closed on
Mar 5, 2002
Sold by
Wong Simon C
Bought by
Kohon Enterprises Inc
Purchase Details
Closed on
Dec 18, 2001
Sold by
Wong Carol O P
Bought by
Wong Simon C
Home Financials for this Owner
Home Financials are based on the most recent Mortgage that was taken out on this home.
Original Mortgage
$312,000
Interest Rate
4.87%
Create a Home Valuation Report for This Property
The Home Valuation Report is an in-depth analysis detailing your home's value as well as a comparison with similar homes in the area
Home Values in the Area
Average Home Value in this Area
Purchase History
| Date | Buyer | Sale Price | Title Company |
|---|---|---|---|
| Liang Jennifer | -- | Mortgage Connect | |
| Liang Yvonne | -- | Mortgage Connect Lp | |
| Liang Yvonne | -- | Mortgage Connect | |
| Liang Jennifer | -- | None Available | |
| Liang Yvonne | -- | None Available | |
| Liang Yvonne | -- | Fidelity National Title Co | |
| Liang Jennifer | -- | Fidelity National Title Co | |
| Liang Yvonne | $400,000 | Old Republic Title Company | |
| Zhou Jian Xiong | $450,000 | Alliance Title Company | |
| Wong Simon C | -- | Alliance Title Company | |
| Wong Simon C | -- | Chicago Title Insurance Comp | |
| Wong Simon C | -- | Chicago Title Co | |
| Wong Simon C | -- | -- | |
| Kohon Enterprises Inc | -- | -- | |
| Wong Simon C | -- | Old Republic Title Company | |
| Wong Simon C | $390,000 | Old Republic Title Company |
Source: Public Records
Mortgage History
| Date | Status | Borrower | Loan Amount |
|---|---|---|---|
| Open | Liang Yvonne | $548,250 | |
| Closed | Liang Yvonne | $417,000 | |
| Previous Owner | Zhou Jian Xiong | $360,000 | |
| Previous Owner | Wong Simon C | $438,750 | |
| Previous Owner | Wong Simon C | $114,900 | |
| Previous Owner | Wong Simon C | $312,000 |
Source: Public Records
Tax History Compared to Growth
Tax History
| Year | Tax Paid | Tax Assessment Tax Assessment Total Assessment is a certain percentage of the fair market value that is determined by local assessors to be the total taxable value of land and additions on the property. | Land | Improvement |
|---|---|---|---|---|
| 2025 | $7,998 | $668,763 | $258,155 | $410,608 |
| 2023 | $7,998 | $642,798 | $248,132 | $394,666 |
| 2022 | $7,433 | $630,195 | $243,267 | $386,928 |
| 2021 | $7,336 | $617,841 | $238,498 | $379,343 |
| 2020 | $7,245 | $611,507 | $236,053 | $375,454 |
| 2019 | $7,169 | $599,518 | $231,425 | $368,093 |
| 2018 | $6,999 | $587,765 | $226,888 | $360,877 |
| 2017 | $6,819 | $576,242 | $222,440 | $353,802 |
| 2016 | $6,674 | $564,945 | $218,079 | $346,866 |
| 2015 | $6,566 | $556,461 | $214,804 | $341,657 |
| 2014 | $6,425 | $545,563 | $210,597 | $334,966 |
Source: Public Records
Map
Nearby Homes
- 247 Rainier Ave
- 719 Circle Ct
- 632 1st Ln
- 645 Baden Ave Unit 4
- 729 Grand Ave
- 311 Magnolia Ave
- 577 Miller Ave
- 573 Miller Ave
- 214 Manor Dr
- 728 Cottonwood Ave
- 0 Indio Dr
- 453 Grand Ave
- 20 Maple Ave
- 322 Commercial Ave
- 400 Miller Ave
- 829 Stonegate Dr
- 252 Sequoia Ave
- 19 Escanyo Dr
- 123 Appian Way
- 1488 El Camino Real Unit 211