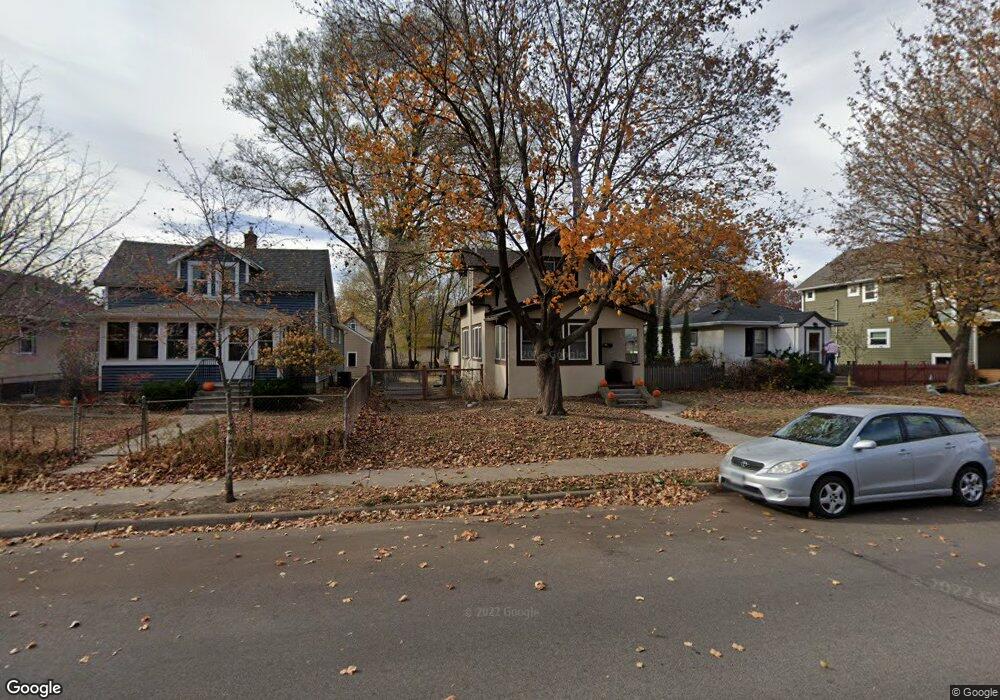
4142 42nd Ave S Minneapolis, MN 55406
Hiawatha NeighborhoodEstimated Value: $352,159 - $372,000
2
Beds
1
Bath
1,692
Sq Ft
$215/Sq Ft
Est. Value
About This Home
This home is located at 4142 42nd Ave S, Minneapolis, MN 55406 and is currently estimated at $363,040, approximately $214 per square foot. 4142 42nd Ave S is a home located in Hennepin County with nearby schools including Hiawatha Community School, Howe Elementary School, and Sanford Middle School.
Ownership History
Date
Name
Owned For
Owner Type
Purchase Details
Closed on
Sep 21, 2020
Sold by
Henkle Benjamin and Henkle Jill J
Bought by
Reid Fiona and Emst Justin
Current Estimated Value
Home Financials for this Owner
Home Financials are based on the most recent Mortgage that was taken out on this home.
Original Mortgage
$291,000
Outstanding Balance
$258,243
Interest Rate
2.9%
Mortgage Type
New Conventional
Estimated Equity
$104,797
Purchase Details
Closed on
Jun 12, 2017
Sold by
Bloomington 9321 Llc
Bought by
Henkle Benjamin
Home Financials for this Owner
Home Financials are based on the most recent Mortgage that was taken out on this home.
Original Mortgage
$230,375
Interest Rate
2.25%
Mortgage Type
Undefined Multiple Amounts
Purchase Details
Closed on
Nov 23, 2016
Sold by
Lillie Lynette M
Bought by
Bloomington 9321 Llc
Home Financials for this Owner
Home Financials are based on the most recent Mortgage that was taken out on this home.
Original Mortgage
$150,000
Interest Rate
3.52%
Mortgage Type
Purchase Money Mortgage
Create a Home Valuation Report for This Property
The Home Valuation Report is an in-depth analysis detailing your home's value as well as a comparison with similar homes in the area
Home Values in the Area
Average Home Value in this Area
Purchase History
| Date | Buyer | Sale Price | Title Company |
|---|---|---|---|
| Reid Fiona | $315,000 | Burnet Title | |
| Henkle Benjamin | $242,500 | Watermark Title Agency | |
| Bloomington 9321 Llc | $99,939 | Custom Home Builders Title L |
Source: Public Records
Mortgage History
| Date | Status | Borrower | Loan Amount |
|---|---|---|---|
| Open | Reid Fiona | $291,000 | |
| Previous Owner | Henkle Benjamin | $230,375 | |
| Previous Owner | Bloomington 9321 Llc | $150,000 |
Source: Public Records
Tax History Compared to Growth
Tax History
| Year | Tax Paid | Tax Assessment Tax Assessment Total Assessment is a certain percentage of the fair market value that is determined by local assessors to be the total taxable value of land and additions on the property. | Land | Improvement |
|---|---|---|---|---|
| 2024 | $4,729 | $333,000 | $134,000 | $199,000 |
| 2023 | $4,439 | $343,000 | $134,000 | $209,000 |
| 2022 | $4,267 | $341,000 | $109,000 | $232,000 |
| 2021 | $3,371 | $312,000 | $84,000 | $228,000 |
| 2020 | $3,280 | $264,000 | $59,400 | $204,600 |
| 2019 | $3,382 | $240,000 | $43,800 | $196,200 |
| 2018 | $2,044 | $240,000 | $43,800 | $196,200 |
| 2017 | $2,410 | $156,500 | $39,800 | $116,700 |
| 2016 | $2,627 | $153,500 | $39,800 | $113,700 |
| 2015 | $2,073 | $145,000 | $39,800 | $105,200 |
| 2014 | -- | $135,500 | $38,400 | $97,100 |
Source: Public Records
Map
Nearby Homes
- 4324 41st Ave S
- 4121 45th Ave S
- 4217 45th Ave S
- 4026 39th Ave S
- 4243 Minnehaha Ave
- 4336 46th Ave S
- 3841 41st Ave S
- 3856 45th Ave S
- 3852 39th Ave S
- 3901 45th Ave S
- 4500 45th Ave S
- 4520 41st Ave S
- 4736 Coffey Ln
- 4541 42nd Ave S
- 4201 33rd Ave S
- 4332 34th Ave S
- 3848 Minnehaha Ave
- 3632 43rd Ave S
- 3860 Snelling Ave
- 4126 31st Ave S
- 4138 42nd Ave S
- 4146 42nd Ave S
- 4146 4146 42nd-Avenue-s
- 4150 42nd Ave S
- 4134 42nd Ave S
- 4156 42nd Ave S
- 4143 41st Ave S
- 4139 41st Ave S
- 4147 41st Ave S
- 4126 42nd Ave S
- 4135 41st Ave S
- 4131 41st Ave S
- 4137 4137 42nd-Avenue-s
- 4145 42nd Ave S
- 4149 42nd Ave S
- 4141 42nd Ave S
- 4149 4149 42nd-Avenue-s
- 4122 42nd Ave S
- 4153 42nd Ave S
- 4137 42nd Ave S