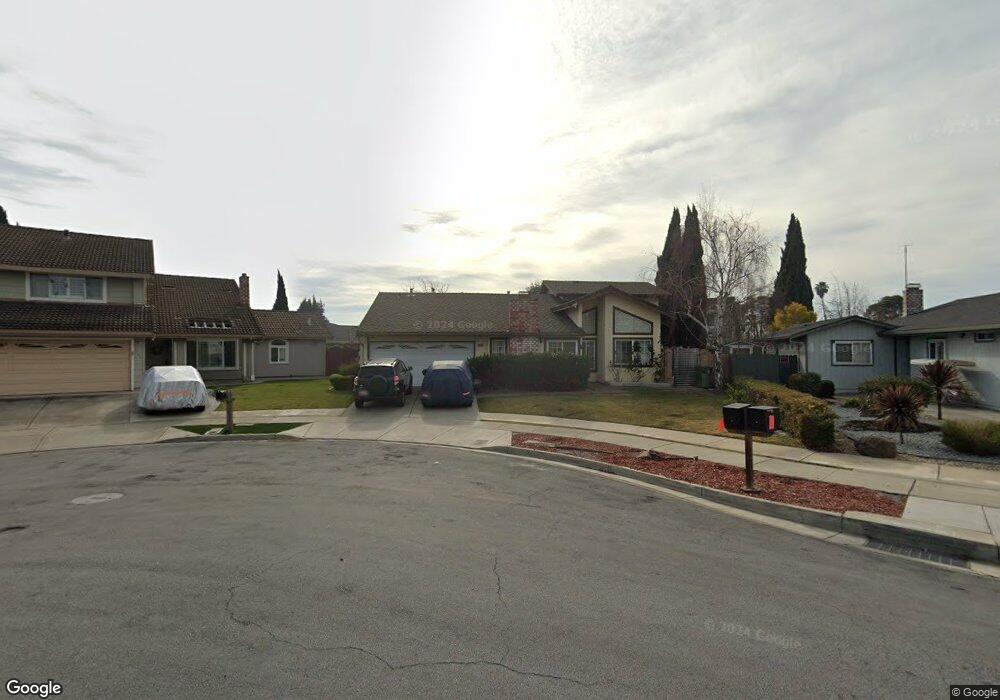
4142 Polonius Cir Fremont, CA 94555
Ardenwood NeighborhoodEstimated Value: $1,730,000 - $2,349,000
4
Beds
2
Baths
1,629
Sq Ft
$1,246/Sq Ft
Est. Value
About This Home
This home is located at 4142 Polonius Cir, Fremont, CA 94555 and is currently estimated at $2,029,818, approximately $1,246 per square foot. 4142 Polonius Cir is a home located in Alameda County with nearby schools including Ardenwood Elementary, Thornton Middle School, and American High School.
Ownership History
Date
Name
Owned For
Owner Type
Purchase Details
Closed on
Feb 2, 2025
Sold by
Dashora Mahesh and Dashora Prerana
Bought by
Dashora Family Trust and Dashora
Current Estimated Value
Purchase Details
Closed on
Nov 15, 2005
Sold by
Easterday Gayle E and Easterday Gary B
Bought by
Dashora Mahesh and Dashora Prerana
Home Financials for this Owner
Home Financials are based on the most recent Mortgage that was taken out on this home.
Original Mortgage
$536,000
Interest Rate
6.5%
Mortgage Type
Fannie Mae Freddie Mac
Purchase Details
Closed on
Jul 16, 2004
Sold by
Easterday Gary and Easterday Gayle
Bought by
Easterday Gary B and Easterday Gayle
Home Financials for this Owner
Home Financials are based on the most recent Mortgage that was taken out on this home.
Original Mortgage
$350,000
Interest Rate
6.27%
Mortgage Type
New Conventional
Create a Home Valuation Report for This Property
The Home Valuation Report is an in-depth analysis detailing your home's value as well as a comparison with similar homes in the area
Home Values in the Area
Average Home Value in this Area
Purchase History
| Date | Buyer | Sale Price | Title Company |
|---|---|---|---|
| Dashora Family Trust | -- | None Listed On Document | |
| Dashora Mahesh | $670,000 | New Century Title Company | |
| Easterday Gary B | -- | Chicago Title Company |
Source: Public Records
Mortgage History
| Date | Status | Borrower | Loan Amount |
|---|---|---|---|
| Previous Owner | Dashora Mahesh | $536,000 | |
| Previous Owner | Easterday Gary B | $350,000 |
Source: Public Records
Tax History Compared to Growth
Tax History
| Year | Tax Paid | Tax Assessment Tax Assessment Total Assessment is a certain percentage of the fair market value that is determined by local assessors to be the total taxable value of land and additions on the property. | Land | Improvement |
|---|---|---|---|---|
| 2025 | $12,081 | $1,014,070 | $274,658 | $746,412 |
| 2024 | $12,081 | $994,052 | $269,273 | $731,779 |
| 2023 | $11,762 | $981,429 | $263,995 | $717,434 |
| 2022 | $11,616 | $955,188 | $258,819 | $703,369 |
| 2021 | $11,328 | $936,328 | $253,746 | $689,582 |
| 2020 | $11,381 | $933,658 | $251,145 | $682,513 |
| 2019 | $11,250 | $915,358 | $246,222 | $669,136 |
| 2018 | $10,800 | $877,716 | $241,396 | $636,320 |
| 2017 | $10,312 | $841,885 | $236,665 | $605,220 |
| 2016 | $10,139 | $825,382 | $232,026 | $593,356 |
| 2015 | $10,006 | $812,991 | $228,543 | $584,448 |
| 2014 | $9,836 | $797,067 | $224,066 | $573,001 |
Source: Public Records
Map
Nearby Homes
- 4243 Nerissa Cir
- 4141 Deep Creek Rd Unit 137
- 4480 Norocco Cir
- 4516 Roderigo Ct
- 4512 Macbeth Ave
- 3691 Thrush Terrace
- 3851 Milton Terrace
- 3840 Springfield Common
- 33283 Sunriver Common
- 3355 Winter Wren Place
- 33228 Jamie Cir
- 33162 Lake Pyramid St
- 4272 Warbler Loop
- 34552 Nantucket Common
- 34512 Nantucket Common
- 34179 Bowling Green Common
- 34579 Bluestone Common
- 4015 Clydesdale Common
- 328 Waikiki Cir
- 33911 Mello Way
- 4132 Polonius Cir
- 4152 Polonius Cir
- 33746 Shylock Dr
- 33768 Shylock Dr
- 33726 Shylock Dr
- 4122 Polonius Cir
- 4205 Nerissa Cir
- 4162 Polonius Cir
- 4211 Nerissa Cir
- 4201 Nerissa Cir
- 4217 Nerissa Cir
- 33710 Shylock Dr
- 4112 Polonius Cir
- 4172 Polonius Cir
- 4147 Polonius Cir
- 4221 Nerissa Cir
- 4157 Polonius Cir
- 4102 Polonius Cir
- 4227 Nerissa Cir
- 4167 Polonius Cir