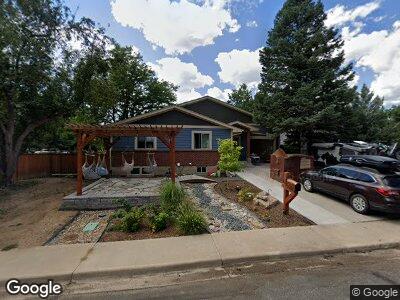
4145 Cooper Ct Boulder, CO 80303
Estimated Value: $884,000 - $1,094,000
3
Beds
2
Baths
2,494
Sq Ft
$411/Sq Ft
Est. Value
About This Home
This home is located at 4145 Cooper Ct, Boulder, CO 80303 and is currently estimated at $1,025,484, approximately $411 per square foot. 4145 Cooper Ct is a home located in Boulder County with nearby schools including Creekside Elementary School, Manhattan Middle School of the Arts & Academics, and Fairview High School.
Ownership History
Date
Name
Owned For
Owner Type
Purchase Details
Closed on
Jan 6, 2014
Sold by
Allen Thomas Marsland
Bought by
Krugman Matthew Joseph
Current Estimated Value
Home Financials for this Owner
Home Financials are based on the most recent Mortgage that was taken out on this home.
Original Mortgage
$388,260
Interest Rate
4.26%
Mortgage Type
New Conventional
Purchase Details
Closed on
Nov 27, 1996
Sold by
Marsland Allen Marie S and Marsland Thomas
Bought by
Allen Thomas Marsland
Purchase Details
Closed on
Jan 26, 1984
Bought by
Krugman Matthew Joseph and Krugman Kimberly Anne
Purchase Details
Closed on
Jun 3, 1980
Bought by
Krugman Matthew Joseph and Krugman Kimberly Anne
Purchase Details
Closed on
Jan 23, 1978
Bought by
Krugman Matthew Joseph and Krugman Kimberly Anne
Create a Home Valuation Report for This Property
The Home Valuation Report is an in-depth analysis detailing your home's value as well as a comparison with similar homes in the area
Home Values in the Area
Average Home Value in this Area
Purchase History
| Date | Buyer | Sale Price | Title Company |
|---|---|---|---|
| Krugman Matthew Joseph | $431,400 | Fidelity National Title Insu | |
| Allen Thomas Marsland | -- | -- | |
| Krugman Matthew Joseph | $92,000 | -- | |
| Krugman Matthew Joseph | $6,000 | -- | |
| Krugman Matthew Joseph | $59,900 | -- |
Source: Public Records
Mortgage History
| Date | Status | Borrower | Loan Amount |
|---|---|---|---|
| Open | Krugman Matthew Joseph | $447,862 | |
| Closed | Krugman Matthew Joseph | $150,000 | |
| Closed | Krugman Matthew Joseph | $389,000 | |
| Closed | Krugman Matthew Joseph | $388,260 |
Source: Public Records
Tax History Compared to Growth
Tax History
| Year | Tax Paid | Tax Assessment Tax Assessment Total Assessment is a certain percentage of the fair market value that is determined by local assessors to be the total taxable value of land and additions on the property. | Land | Improvement |
|---|---|---|---|---|
| 2024 | $6,239 | $64,875 | $35,531 | $29,344 |
| 2023 | $6,131 | $70,993 | $41,674 | $33,004 |
| 2022 | $5,202 | $56,017 | $29,913 | $26,104 |
| 2021 | $4,960 | $57,629 | $30,774 | $26,855 |
| 2020 | $4,427 | $50,858 | $26,956 | $23,902 |
| 2019 | $4,359 | $50,858 | $26,956 | $23,902 |
| 2018 | $4,088 | $47,153 | $25,344 | $21,809 |
| 2017 | $3,960 | $52,130 | $28,019 | $24,111 |
| 2016 | $3,733 | $43,119 | $18,069 | $25,050 |
| 2015 | $3,535 | $31,299 | $17,592 | $13,707 |
| 2014 | $2,632 | $31,299 | $17,592 | $13,707 |
Source: Public Records
Map
Nearby Homes
- 4120 Aurora Ave
- 4150 Monroe Dr Unit C
- 4160 Monroe Dr Unit B
- 4140 Monroe Dr Unit C
- 4326 Clay Commons Ct Unit 4326
- 790 Mohawk Dr
- 4350 Monroe Dr
- 4062 Pinon Dr
- 4475 Laguna Place Unit 201
- 4475 Laguna Place Unit 206
- 4500 Baseline Rd Unit 4402
- 4500 Baseline Rd Unit 3302
- 4500 Baseline Rd Unit 3203
- 4500 Baseline Rd Unit 3101
- 4500 Baseline Rd Unit 4104
- 4500 Baseline Rd Unit 1208
- 3840 Colorado Ave Unit D
- 1180 Monroe Dr Unit C
- 3860 Colorado Ave Unit C
- 4425 Comanche Dr