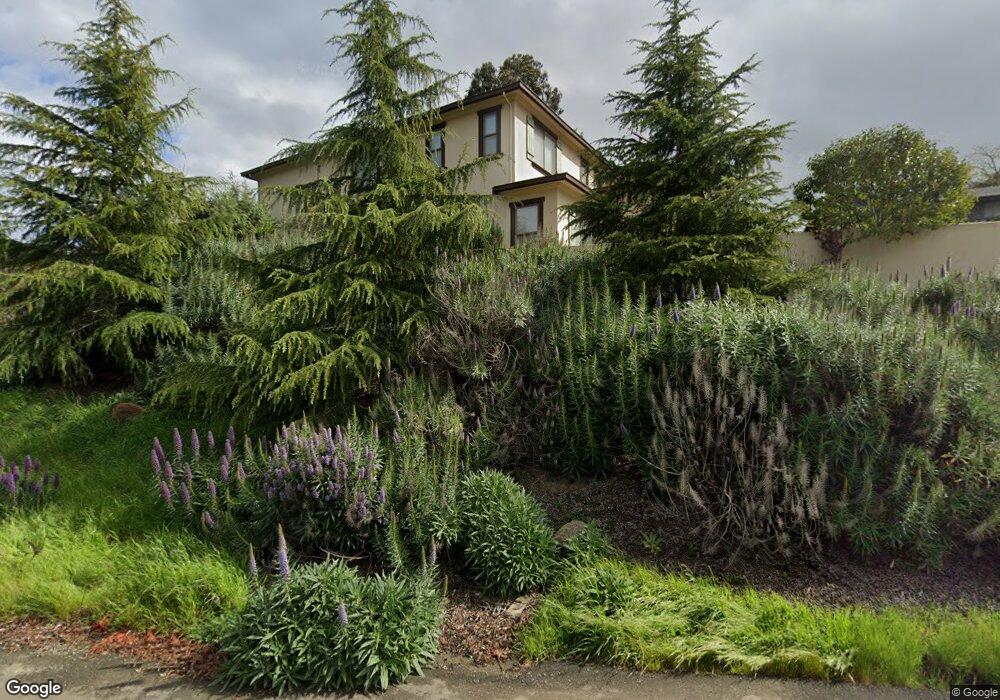
4145 Dingley St Oakland, CA 94605
Chabot Park NeighborhoodEstimated Value: $1,407,000 - $2,113,000
5
Beds
4
Baths
3,550
Sq Ft
$475/Sq Ft
Est. Value
About This Home
This home is located at 4145 Dingley St, Oakland, CA 94605 and is currently estimated at $1,686,956, approximately $475 per square foot. 4145 Dingley St is a home located in Alameda County with nearby schools including Grass Valley Elementary School, Elmhurst United Middle School, and Skyline High School.
Ownership History
Date
Name
Owned For
Owner Type
Purchase Details
Closed on
Aug 18, 2015
Sold by
Mapes Clifford and Mapes Denise
Bought by
Redmond Family Living Trust
Current Estimated Value
Purchase Details
Closed on
Dec 28, 2012
Sold by
Plant Dennis
Bought by
Mapes Clifford
Purchase Details
Closed on
Dec 9, 2002
Sold by
Gregory Joewoen
Bought by
Mapes Clifford and Plant Dennis
Create a Home Valuation Report for This Property
The Home Valuation Report is an in-depth analysis detailing your home's value as well as a comparison with similar homes in the area
Home Values in the Area
Average Home Value in this Area
Purchase History
| Date | Buyer | Sale Price | Title Company |
|---|---|---|---|
| Redmond Family Living Trust | $1,338,000 | Placer Title Company | |
| Mapes Clifford | $75,000 | None Available | |
| Mapes Clifford | $175,000 | Placer Title Company |
Source: Public Records
Tax History Compared to Growth
Tax History
| Year | Tax Paid | Tax Assessment Tax Assessment Total Assessment is a certain percentage of the fair market value that is determined by local assessors to be the total taxable value of land and additions on the property. | Land | Improvement |
|---|---|---|---|---|
| 2025 | $21,788 | $1,583,883 | $475,165 | $1,108,718 |
| 2024 | $21,788 | $1,552,828 | $465,848 | $1,086,980 |
| 2023 | $23,027 | $1,522,388 | $456,716 | $1,065,672 |
| 2022 | $22,533 | $1,492,538 | $447,761 | $1,044,777 |
| 2021 | $21,822 | $1,463,276 | $438,983 | $1,024,293 |
| 2020 | $21,580 | $1,448,277 | $434,483 | $1,013,794 |
| 2019 | $20,945 | $1,419,884 | $425,965 | $993,919 |
| 2018 | $20,122 | $1,392,054 | $417,616 | $974,438 |
| 2017 | $19,421 | $1,364,760 | $409,428 | $955,332 |
| 2016 | $18,950 | $1,338,000 | $401,400 | $936,600 |
| 2015 | $14,125 | $971,324 | $246,324 | $725,000 |
| 2014 | $6,371 | $392,500 | $241,500 | $151,000 |
Source: Public Records
Map
Nearby Homes
- 0 Lochard St Unit 41113902
- 11201 Lochard St
- 11320 Lochard St
- 10838 Monan St
- 11388 Lochard St
- 9 Leamont Ct
- 11275 Kerrigan Dr
- 25 Woodcliff Ct
- 10910 Glen Artney St
- 4847 Dunkirk Ave
- 10353 Royal Oak Rd
- 10492 Royal Oak Rd
- 10317 Royal Oak Rd
- 3910 Oak Hill Rd
- 142 Sequoyah View Dr
- 10768 Sheldon St
- 85 Sequoyah View Dr
- 10601 Sheldon St
- 2 Sequoyah View Dr
- 3818-3818A Northridge Ave
- 4245 Roderick Rd
- 4222 Roderick Rd
- 10840 Cameron Ave
- 10889 Lochard St
- 10900 Cameron Ave
- 10901 Cliffland Ave
- 10828 Cameron Ave
- 10919 Lochard St
- 4200 Roderick Rd
- 10841 Lochard St
- 10820 Cameron Ave
- 10922 Cameron Ave
- 10841 Cameron Ave
- 10931 Lochard St
- 10925 Cliffland Ave
- 10800 Cameron Ave
- 10901 Cameron Ave
- 10870 Lochard St
- 4134 Malcolm Ave
- 10900 Lochard St