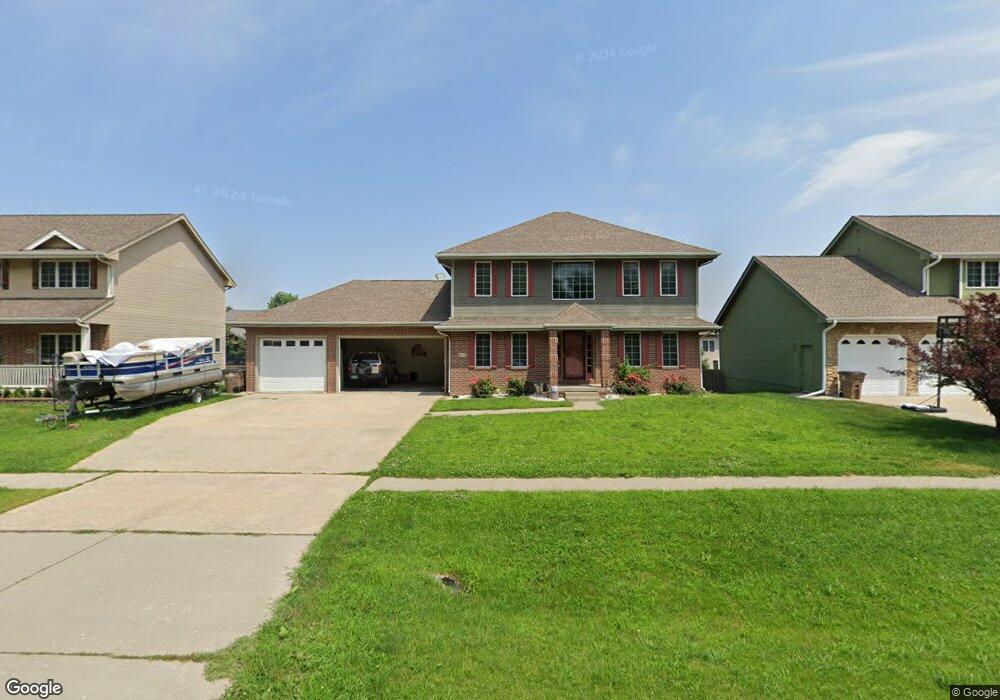
415 9th St NW Altoona, IA 50009
Estimated Value: $392,000 - $409,000
5
Beds
3
Baths
2,096
Sq Ft
$192/Sq Ft
Est. Value
About This Home
This home is located at 415 9th St NW, Altoona, IA 50009 and is currently estimated at $402,826, approximately $192 per square foot. 415 9th St NW is a home located in Polk County with nearby schools including Altoona Elementary School, Southeast Polk Spring Creek- 6th Grade, and Southeast Polk Junior High School.
Ownership History
Date
Name
Owned For
Owner Type
Purchase Details
Closed on
Nov 21, 2008
Sold by
Smith M E
Bought by
Borges Jorge and Borges Marla A
Current Estimated Value
Home Financials for this Owner
Home Financials are based on the most recent Mortgage that was taken out on this home.
Original Mortgage
$223,040
Outstanding Balance
$145,465
Interest Rate
5.95%
Mortgage Type
FHA
Estimated Equity
$257,361
Purchase Details
Closed on
Jul 10, 2008
Sold by
Higgins Anthony D and Higgins Ramona J
Bought by
415 9Th Street North West Land Trust
Purchase Details
Closed on
Jul 31, 2006
Sold by
Anw Builders Llc
Bought by
Higgins Anthony D
Home Financials for this Owner
Home Financials are based on the most recent Mortgage that was taken out on this home.
Original Mortgage
$278,900
Interest Rate
7.87%
Mortgage Type
Balloon
Create a Home Valuation Report for This Property
The Home Valuation Report is an in-depth analysis detailing your home's value as well as a comparison with similar homes in the area
Home Values in the Area
Average Home Value in this Area
Purchase History
| Date | Buyer | Sale Price | Title Company |
|---|---|---|---|
| Borges Jorge | $224,500 | Itc | |
| 415 9Th Street North West Land Trust | -- | None Available | |
| Higgins Anthony D | $278,500 | None Available |
Source: Public Records
Mortgage History
| Date | Status | Borrower | Loan Amount |
|---|---|---|---|
| Open | Borges Jorge | $223,040 | |
| Previous Owner | Higgins Anthony D | $278,900 |
Source: Public Records
Tax History Compared to Growth
Tax History
| Year | Tax Paid | Tax Assessment Tax Assessment Total Assessment is a certain percentage of the fair market value that is determined by local assessors to be the total taxable value of land and additions on the property. | Land | Improvement |
|---|---|---|---|---|
| 2025 | $6,722 | $440,300 | $85,400 | $354,900 |
| 2024 | $6,722 | $400,700 | $76,000 | $324,700 |
| 2023 | $6,666 | $400,700 | $76,000 | $324,700 |
| 2022 | $6,580 | $335,600 | $65,900 | $269,700 |
| 2021 | $6,480 | $335,600 | $65,900 | $269,700 |
| 2020 | $6,370 | $314,600 | $61,600 | $253,000 |
| 2019 | $6,120 | $314,600 | $61,600 | $253,000 |
| 2018 | $6,126 | $297,000 | $57,000 | $240,000 |
| 2017 | $6,288 | $297,000 | $57,000 | $240,000 |
| 2016 | $6,270 | $276,600 | $52,300 | $224,300 |
| 2015 | $6,270 | $276,600 | $52,300 | $224,300 |
| 2014 | $6,006 | $262,900 | $50,000 | $212,900 |
Source: Public Records
Map
Nearby Homes
- 512 3rd Ave NW
- 507 4th St NW
- 1005 6th St NW
- 944 Sunburst Ln
- 935 Breezewood Cir
- 1028 7th St NW
- 983 10th Ave NW
- 1013 10th Ave NW
- 1046 10th Ave NW
- 612 12th Ave NW
- 107 10th Ave SW
- 302 12th Ave NW
- 202 11th Ave NW
- 213 10th Ave SW
- 106 12th Ave NW
- 717 37th St SW
- 210 11th Ave SW
- 1634 Prairie Cir
- 800 36th St SW
- 1605 2nd St NW