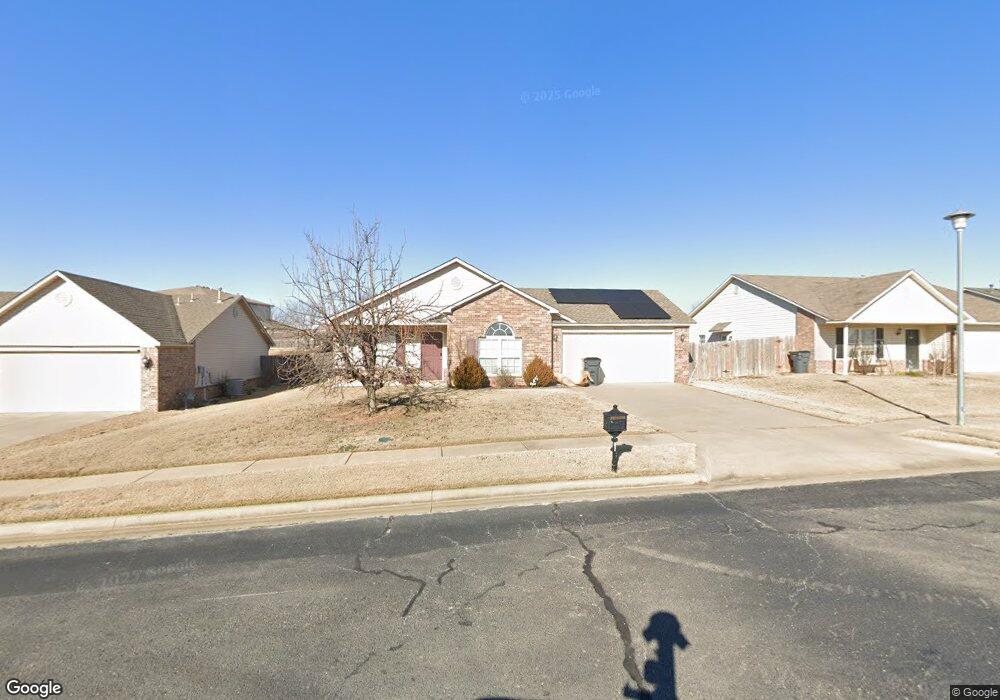
415 E 149th St Glenpool, OK 74033
Estimated Value: $229,000 - $244,000
3
Beds
2
Baths
1,486
Sq Ft
$160/Sq Ft
Est. Value
About This Home
This home is located at 415 E 149th St, Glenpool, OK 74033 and is currently estimated at $237,756, approximately $159 per square foot. 415 E 149th St is a home located in Tulsa County with nearby schools including Glenpool Elementary School, Glenpool Middle School, and Glenpool High School.
Ownership History
Date
Name
Owned For
Owner Type
Purchase Details
Closed on
May 24, 2024
Sold by
Finks Sue
Bought by
Sue Ellen Finks Trust and Finks
Current Estimated Value
Purchase Details
Closed on
Apr 15, 2017
Sold by
Dbm Enterprices Llc
Bought by
Finks Sue
Home Financials for this Owner
Home Financials are based on the most recent Mortgage that was taken out on this home.
Original Mortgage
$148,000
Interest Rate
4.23%
Mortgage Type
VA
Purchase Details
Closed on
May 26, 2016
Sold by
Lakey Erica M
Bought by
Jpmorgan Chase Bank Na
Purchase Details
Closed on
May 14, 2010
Sold by
Rausch Coleman Ss Llc
Bought by
Lakey Erica M
Home Financials for this Owner
Home Financials are based on the most recent Mortgage that was taken out on this home.
Original Mortgage
$138,847
Interest Rate
5.02%
Mortgage Type
New Conventional
Create a Home Valuation Report for This Property
The Home Valuation Report is an in-depth analysis detailing your home's value as well as a comparison with similar homes in the area
Home Values in the Area
Average Home Value in this Area
Purchase History
| Date | Buyer | Sale Price | Title Company |
|---|---|---|---|
| Sue Ellen Finks Trust | -- | None Listed On Document | |
| Finks Sue | -- | First American Title | |
| Jpmorgan Chase Bank Na | -- | None Available | |
| Lakey Erica M | $136,500 | Multiple |
Source: Public Records
Mortgage History
| Date | Status | Borrower | Loan Amount |
|---|---|---|---|
| Previous Owner | Finks Sue | $148,000 | |
| Previous Owner | Lakey Erica M | $138,847 |
Source: Public Records
Tax History
| Year | Tax Paid | Tax Assessment Tax Assessment Total Assessment is a certain percentage of the fair market value that is determined by local assessors to be the total taxable value of land and additions on the property. | Land | Improvement |
|---|---|---|---|---|
| 2025 | $2,077 | $17,324 | $2,316 | $15,008 |
| 2024 | $1,905 | $16,789 | $2,347 | $14,442 |
| 2023 | $1,905 | $17,271 | $2,650 | $14,621 |
| 2022 | $1,817 | $15,768 | $2,983 | $12,785 |
| 2021 | $1,788 | $15,280 | $2,891 | $12,389 |
| 2020 | $1,802 | $15,280 | $2,891 | $12,389 |
| 2019 | $1,814 | $15,280 | $2,891 | $12,389 |
| 2018 | $1,924 | $16,280 | $3,080 | $13,200 |
| 2017 | $1,730 | $14,960 | $3,080 | $11,880 |
| 2016 | $1,637 | $15,015 | $3,080 | $11,935 |
| 2015 | $1,629 | $15,015 | $3,080 | $11,935 |
| 2014 | $1,636 | $15,015 | $3,080 | $11,935 |
Source: Public Records
Map
Nearby Homes
- 14920 S Sequoia St
- 650 E 149th St S
- 14910 S Sequoia St
- 670 E 149th St S
- 667 E 149th St S
- 14772 S Fern Place
- 668 E 148th Place S
- 712 E 149th St S
- 690 E 149th St S
- 711 E 149th St S
- 663 E 148th Place S
- 14760 S Fern Place
- 754 E 149th St S
- 394 E 147th St S
- 849 E 148th Place S
- 41 E 148th St
- 688 E 148th Place S
- 571 W 149th Place
- 463 W 147th St
- 14659 S Nyssa Place
- 409 E 149th St S
- 405 E 149th St S
- 405 E 149th St
- 415 E 149th St S
- 401 E 149th St
- 412 E 149th St
- 408 E 149th St
- 410 E 148th Cir
- 412 E 149th St S
- 404 E 149th St
- 421 E 149th St
- 414 E 148th Cir
- 425 E 149th St
- 406 E 148th Cir
- 420 E 149th St
- 400 E 149th St
- 429 E 149th St
- 424 E 149th St
- 402 E 148th Cir
- 14992 Fern Ct
Your Personal Tour Guide
Ask me questions while you tour the home.