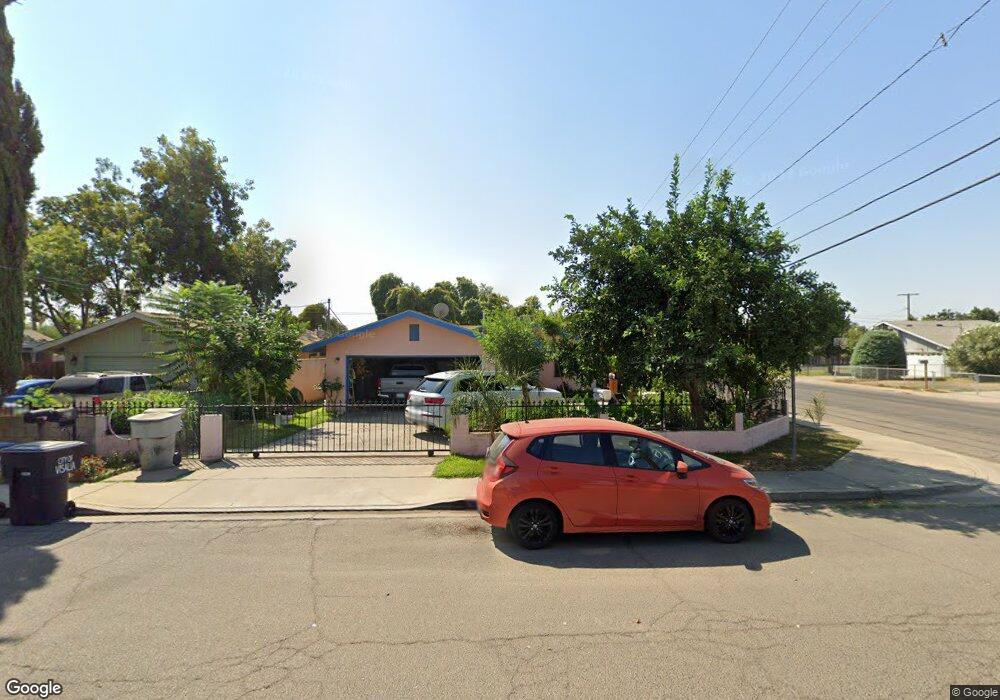
415 E Parker Ct Visalia, CA 93291
North Visalia NeighborhoodEstimated Value: $250,000 - $306,884
3
Beds
2
Baths
1,222
Sq Ft
$227/Sq Ft
Est. Value
About This Home
This home is located at 415 E Parker Ct, Visalia, CA 93291 and is currently estimated at $276,971, approximately $226 per square foot. 415 E Parker Ct is a home located in Tulare County with nearby schools including Crowley Elementary School, Divisadero Middle School, and Mt. Whitney High School.
Ownership History
Date
Name
Owned For
Owner Type
Purchase Details
Closed on
May 17, 2004
Sold by
Keovilay Cha Sae
Bought by
Keovilay Daeng and Keovillay Eena
Current Estimated Value
Purchase Details
Closed on
Nov 19, 2002
Sold by
Vasquez Ruben
Bought by
Keovilay Daeng and Keovilay Eena
Home Financials for this Owner
Home Financials are based on the most recent Mortgage that was taken out on this home.
Original Mortgage
$64,924
Outstanding Balance
$27,394
Interest Rate
6.12%
Mortgage Type
FHA
Estimated Equity
$249,577
Purchase Details
Closed on
Sep 19, 2002
Sold by
Keovilay Voi
Bought by
Keovilay Cha Sae
Create a Home Valuation Report for This Property
The Home Valuation Report is an in-depth analysis detailing your home's value as well as a comparison with similar homes in the area
Home Values in the Area
Average Home Value in this Area
Purchase History
| Date | Buyer | Sale Price | Title Company |
|---|---|---|---|
| Keovilay Daeng | -- | -- | |
| Keovilay Daeng | $84,000 | -- | |
| Keovilay Cha Sae | -- | -- |
Source: Public Records
Mortgage History
| Date | Status | Borrower | Loan Amount |
|---|---|---|---|
| Open | Keovilay Daeng | $64,924 | |
| Closed | Keovilay Daeng | $19,972 |
Source: Public Records
Tax History Compared to Growth
Tax History
| Year | Tax Paid | Tax Assessment Tax Assessment Total Assessment is a certain percentage of the fair market value that is determined by local assessors to be the total taxable value of land and additions on the property. | Land | Improvement |
|---|---|---|---|---|
| 2025 | $1,411 | $140,352 | $33,530 | $106,822 |
| 2024 | $1,411 | $137,601 | $32,873 | $104,728 |
| 2023 | $1,371 | $134,904 | $32,229 | $102,675 |
| 2022 | $1,327 | $132,260 | $31,598 | $100,662 |
| 2021 | $1,308 | $129,666 | $30,978 | $98,688 |
| 2020 | $1,292 | $128,336 | $30,660 | $97,676 |
| 2019 | $1,258 | $125,820 | $30,059 | $95,761 |
| 2018 | $1,220 | $123,353 | $29,470 | $93,883 |
| 2017 | $1,211 | $120,934 | $28,892 | $92,042 |
| 2016 | $1,182 | $118,562 | $28,325 | $90,237 |
| 2015 | $1,146 | $116,782 | $27,900 | $88,882 |
| 2014 | $1,146 | $114,494 | $27,353 | $87,141 |
Source: Public Records
Map
Nearby Homes
- 1633 N Tipton St
- 339 NE 4th Ave
- 219 E Elowin Ct
- 312 NE 4th Ave
- 203 E Harold Ct
- 1432 N Locust St
- 128 W Houston Ave
- 636 E Roosevelt Ave
- 1540 N Encina St
- 841 E Prospect Ave
- 223 W Buena Vista Ave
- 125 N Hicks St Unit A
- 625 E Ferguson Ave
- 1635 N Dinuba Blvd
- 220 NW 1st Ave
- 820 N Floral St
- 601 N Church St
- 6925 W Grove Ave Unit 1016 Sr
- 6925 W Grove Ave
- 6917 W Grove Ave Unit 1017 Sr
- 419 E Parker Ct
- 425 E Parker Ct
- 1526 N Bridge St
- 1539 N Bridge St
- 1545 N Bridge St
- 433 E Parker Ct
- 1614 N Bridge St
- 1531 N Bridge St
- 404 E Sweet Ct
- 414 E Sweet Ct
- 420 E Sweet Ct
- 432 E Sweet Ct
- 426 E Sweet Ct
- 1603 N Bridge St
- 439 E Parker Ct
- 1611 N Bridge St
- 1622 N Bridge St
- 0 E Sweet Ct Unit 161111
- 0 E Sweet Ct Unit 225682
- 430 E Sweet Ct