Estimated Value: $380,000 - $569,000
3
Beds
3
Baths
1,446
Sq Ft
$349/Sq Ft
Est. Value
About This Home
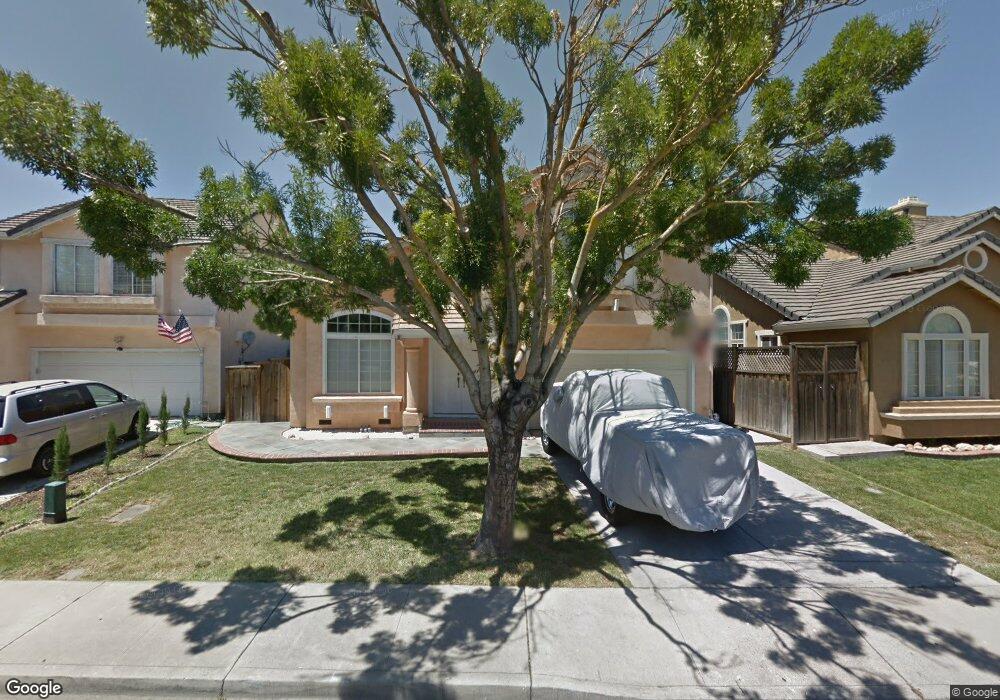
This home is located at 415 Gonzalez St, Tracy, CA 95376 and is currently estimated at $505,218, approximately $349 per square foot. 415 Gonzalez St is a home located in San Joaquin County with nearby schools including Louis A. Bohn Elementary School, Earle E. Williams Middle School, and Tracy High School.
Ownership History
Date
Name
Owned For
Owner Type
Purchase Details
Closed on
Sep 3, 2011
Sold by
Yang Mei Ling and Mei Ling Yang Living Trust
Bought by
Chiu Li Jiun and Li Jiun Chiu Living Trust
Current Estimated Value
Purchase Details
Closed on
Jul 25, 2011
Sold by
Soriano Corazon
Bought by
Yang Mei Ling and Mei Ling Yang Living Trust
Purchase Details
Closed on
Apr 24, 2006
Sold by
Soriano Corazon and Yankiling Corazon S
Bought by
Soriano Corazon
Home Financials for this Owner
Home Financials are based on the most recent Mortgage that was taken out on this home.
Original Mortgage
$367,500
Interest Rate
1%
Mortgage Type
Negative Amortization
Purchase Details
Closed on
Dec 23, 2003
Sold by
Yankiling Mario I and Yankiling Corazon S
Bought by
Yankiling Corazon S
Home Financials for this Owner
Home Financials are based on the most recent Mortgage that was taken out on this home.
Original Mortgage
$252,000
Interest Rate
6.75%
Mortgage Type
New Conventional
Create a Home Valuation Report for This Property
The Home Valuation Report is an in-depth analysis detailing your home's value as well as a comparison with similar homes in the area
Home Values in the Area
Average Home Value in this Area
Purchase History
| Date | Buyer | Sale Price | Title Company |
|---|---|---|---|
| Chiu Li Jiun | -- | None Available | |
| Yang Mei Ling | $150,000 | Old Republic Title Company | |
| Soriano Corazon | -- | Commonwealth Land Title | |
| Yankiling Corazon S | -- | Financial Title Co Stkn |
Source: Public Records
Mortgage History
| Date | Status | Borrower | Loan Amount |
|---|---|---|---|
| Previous Owner | Soriano Corazon | $367,500 | |
| Previous Owner | Yankiling Corazon S | $252,000 |
Source: Public Records
Tax History
| Year | Tax Paid | Tax Assessment Tax Assessment Total Assessment is a certain percentage of the fair market value that is determined by local assessors to be the total taxable value of land and additions on the property. | Land | Improvement |
|---|---|---|---|---|
| 2025 | $2,401 | $188,334 | $46,469 | $141,865 |
| 2024 | $2,224 | $184,642 | $45,558 | $139,084 |
| 2023 | $2,186 | $181,022 | $44,665 | $136,357 |
| 2022 | $2,141 | $177,474 | $43,790 | $133,684 |
| 2021 | $2,112 | $173,995 | $42,932 | $131,063 |
| 2020 | $2,097 | $172,212 | $42,492 | $129,720 |
| 2019 | $2,061 | $168,836 | $41,659 | $127,177 |
| 2018 | $2,266 | $165,527 | $40,843 | $124,684 |
| 2017 | $2,170 | $162,283 | $40,043 | $122,240 |
| 2016 | $2,182 | $159,101 | $39,258 | $119,843 |
| 2014 | $2,073 | $153,643 | $37,911 | $115,732 |
Source: Public Records
Map
Nearby Homes
- 480 Gonzalez St
- 320 Accipiter Ct
- 243 E 3rd St
- 18 W 8th St
- 60 W South St
- 125 E 12th St
- 110 Loma Prieta Cir
- 389 Burlington Dr
- 206 W 12th St
- 448 Burlington Dr
- 515 Peerless Way Unit 13
- 319 W 12th St
- 920 Taft Ave
- 1110 Amaretto Dr
- 145 Machado Ct
- 25820 S Macarthur Dr
- 1330 Bessie Ave
- 1704 East St
- 1636 Parker Ave
- 262 W Lowell Ave
- 421 Gonzalez St
- 411 Gonzalez St
- 431 Gonzalez St
- 401 Gonzalez St
- 410 Gonzalez St
- 420 Gonzalez St
- 441 Gonzalez St
- 381 Gonzalez St
- 400 Gonzalez St
- 430 Gonzalez St
- 440 Gonzalez St
- 451 Gonzalez St
- 361 Gonzalez St
- 411 Falcon Ct
- 401 Falcon Ct
- 380 Gonzalez St
- 421 Falcon Ct
- 450 Gonzalez St
- 431 Falcon Ct
- 455 Gonzalez St
Your Personal Tour Guide
Ask me questions while you tour the home.