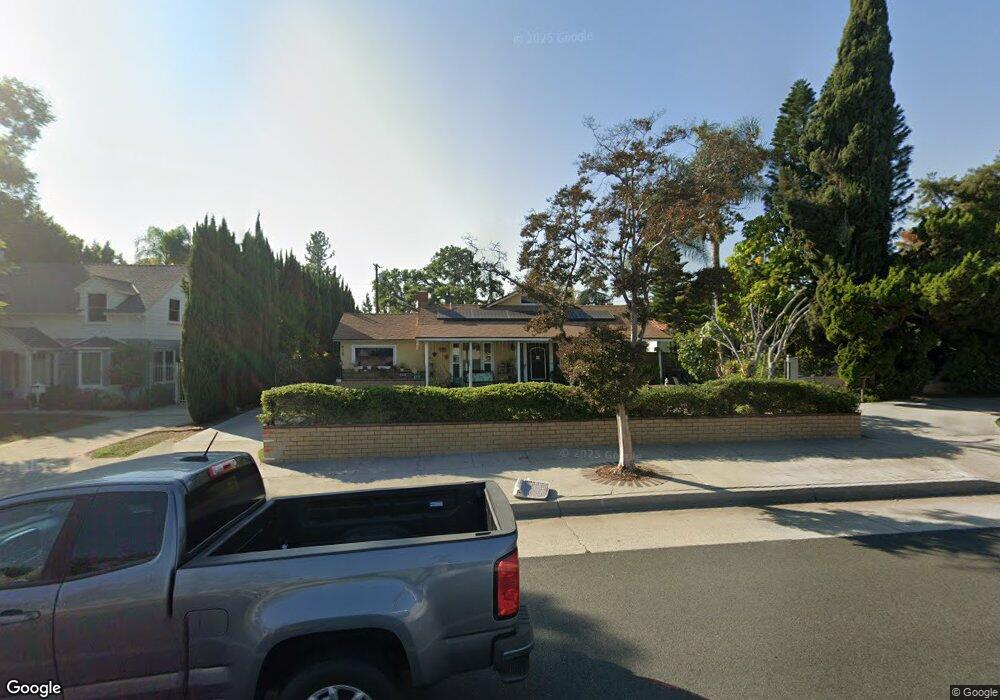
415 N San Gabriel Blvd San Gabriel, CA 91775
North San Gabriel NeighborhoodEstimated Value: $1,394,000 - $1,492,781
5
Beds
3
Baths
1,858
Sq Ft
$773/Sq Ft
Est. Value
About This Home
This home is located at 415 N San Gabriel Blvd, San Gabriel, CA 91775 and is currently estimated at $1,435,945, approximately $772 per square foot. 415 N San Gabriel Blvd is a home located in Los Angeles County with nearby schools including Washington Elementary School, Jefferson Middle School, and Gabrielino High School.
Ownership History
Date
Name
Owned For
Owner Type
Purchase Details
Closed on
Apr 2, 2018
Sold by
Wong Salina Hueboang
Bought by
Wong Salina Hueboang and Danny And Salina Wong Family Trust
Current Estimated Value
Purchase Details
Closed on
Apr 4, 2014
Sold by
Wong Danny
Bought by
Wong Salina
Purchase Details
Closed on
Mar 21, 2006
Sold by
Ellis Sally L and Sally L Ellis Revocable Trust
Bought by
Wong Danny
Home Financials for this Owner
Home Financials are based on the most recent Mortgage that was taken out on this home.
Original Mortgage
$542,400
Outstanding Balance
$237,285
Interest Rate
2.5%
Mortgage Type
Negative Amortization
Estimated Equity
$1,198,660
Purchase Details
Closed on
Jan 21, 2003
Sold by
Ellis Sally L
Bought by
Ellis Sally L and Sally L Ellis Revocable Trust
Create a Home Valuation Report for This Property
The Home Valuation Report is an in-depth analysis detailing your home's value as well as a comparison with similar homes in the area
Home Values in the Area
Average Home Value in this Area
Purchase History
| Date | Buyer | Sale Price | Title Company |
|---|---|---|---|
| Wong Salina Hueboang | -- | None Available | |
| Wong Salina | -- | Accommodation | |
| Wong Danny | $678,000 | Equity Title | |
| Ellis Sally L | -- | -- |
Source: Public Records
Mortgage History
| Date | Status | Borrower | Loan Amount |
|---|---|---|---|
| Open | Wong Danny | $542,400 |
Source: Public Records
Tax History Compared to Growth
Tax History
| Year | Tax Paid | Tax Assessment Tax Assessment Total Assessment is a certain percentage of the fair market value that is determined by local assessors to be the total taxable value of land and additions on the property. | Land | Improvement |
|---|---|---|---|---|
| 2025 | $12,487 | $926,525 | $741,225 | $185,300 |
| 2024 | $12,487 | $908,359 | $726,692 | $181,667 |
| 2023 | $12,269 | $890,549 | $712,444 | $178,105 |
| 2022 | $11,758 | $873,088 | $698,475 | $174,613 |
| 2021 | $11,676 | $855,970 | $684,780 | $171,190 |
| 2019 | $11,163 | $830,583 | $664,470 | $166,113 |
| 2018 | $19,204 | $814,298 | $651,442 | $162,856 |
| 2016 | $10,496 | $782,680 | $626,147 | $156,533 |
| 2015 | $10,350 | $770,924 | $616,742 | $154,182 |
| 2014 | $10,076 | $742,000 | $593,600 | $148,400 |
Source: Public Records
Map
Nearby Homes
- 8215 Beverly Dr
- 118 N Gladys Ave Unit F
- 101 N San Gabriel Blvd
- 428 N Del Mar Ave
- 5716 N Charlotte Ave
- 143 Country Club Dr
- 6013 N Walnut Grove Ave
- 420 E Las Tunas Dr Unit 3C
- 229 Cresta Ave
- 521 N Del Mar Ave
- 8216 Sheffield Rd
- 5633 N Charlotte Ave
- 501 Gerona Ave
- 5613 N Charlotte Ave
- 401 E Live Oak St
- 137 Saint Francis St Unit A
- 532 N San Marino Ave
- 1120 E Las Tunas Dr Unit 2
- 6430 N Vista St
- 8533 Los Olivos Dr
- 411 N San Gabriel Blvd
- 419 N San Gabriel Blvd Unit B
- 419 N San Gabriel Blvd
- 403 N San Gabriel Blvd
- 421 N San Gabriel Blvd
- 709 Santa Ynez Ln
- 416 N Pine St
- 418 N Pine St
- 406 N Pine St
- 400 N Pine St
- 420 N Pine St
- 8200 Bevan St
- 427 N San Gabriel Blvd
- 8205 Bevan St
- 8203 Santa Ynez St
- 428 N Pine St
- 722 Santa Ynez Ln
- 718 Santa Ynez Ln
- 345 N San Gabriel Blvd
- 435 N San Gabriel Blvd