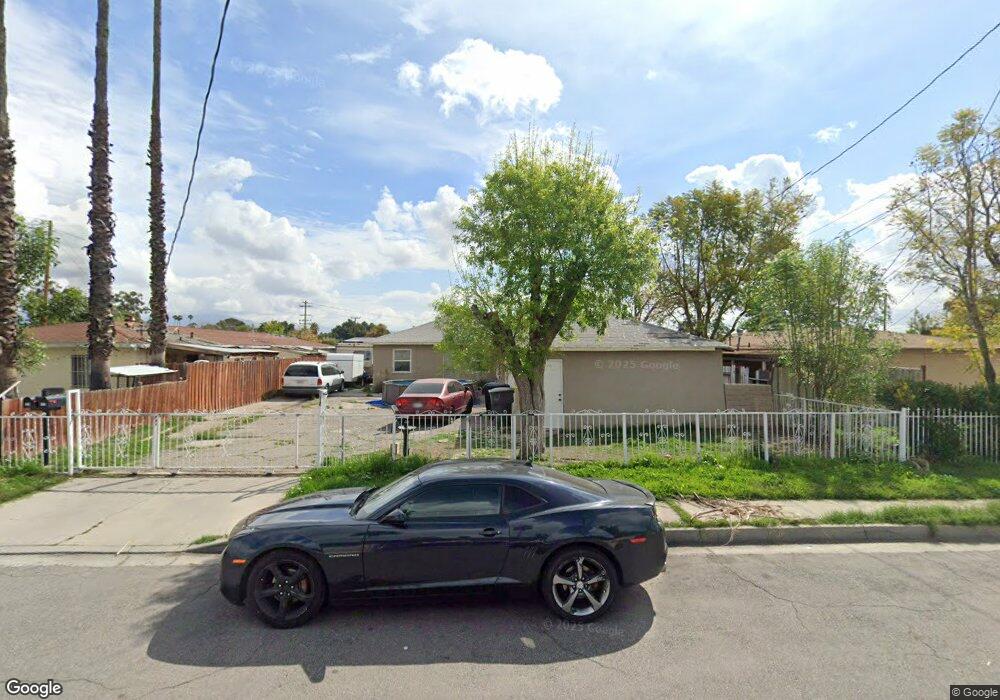
415 Pear St San Bernardino, CA 92410
Lytle Creek NeighborhoodEstimated Value: $437,000 - $577,000
5
Beds
2
Baths
2,084
Sq Ft
$236/Sq Ft
Est. Value
About This Home
This home is located at 415 Pear St, San Bernardino, CA 92410 and is currently estimated at $492,671, approximately $236 per square foot. 415 Pear St is a home located in San Bernardino County with nearby schools including Lytle Creek Elementary School, Curtis Middle School, and Arroyo Valley High School.
Ownership History
Date
Name
Owned For
Owner Type
Purchase Details
Closed on
May 22, 2002
Sold by
Torres V Jose Antonio and Romo Andres
Bought by
Torres Ramon and Torres Nancy
Current Estimated Value
Purchase Details
Closed on
Dec 11, 1995
Sold by
Cerda Luis and Cerda Maria
Bought by
Torres V Jose Antonio and Romo Andres
Home Financials for this Owner
Home Financials are based on the most recent Mortgage that was taken out on this home.
Original Mortgage
$80,982
Interest Rate
6.99%
Mortgage Type
FHA
Create a Home Valuation Report for This Property
The Home Valuation Report is an in-depth analysis detailing your home's value as well as a comparison with similar homes in the area
Home Values in the Area
Average Home Value in this Area
Purchase History
| Date | Buyer | Sale Price | Title Company |
|---|---|---|---|
| Torres Ramon | -- | -- | |
| Torres V Jose Antonio | $88,000 | Orange Coast Title |
Source: Public Records
Mortgage History
| Date | Status | Borrower | Loan Amount |
|---|---|---|---|
| Previous Owner | Torres V Jose Antonio | $80,982 |
Source: Public Records
Tax History Compared to Growth
Tax History
| Year | Tax Paid | Tax Assessment Tax Assessment Total Assessment is a certain percentage of the fair market value that is determined by local assessors to be the total taxable value of land and additions on the property. | Land | Improvement |
|---|---|---|---|---|
| 2025 | $2,473 | $188,285 | $28,965 | $159,320 |
| 2024 | $2,473 | $184,593 | $28,397 | $156,196 |
| 2023 | $2,411 | $180,973 | $27,840 | $153,133 |
| 2022 | $2,413 | $177,424 | $27,294 | $150,130 |
| 2021 | $2,415 | $173,945 | $26,759 | $147,186 |
| 2020 | $2,420 | $172,162 | $26,485 | $145,677 |
| 2019 | $2,350 | $168,787 | $25,966 | $142,821 |
| 2018 | $2,324 | $165,478 | $25,457 | $140,021 |
| 2017 | $2,253 | $162,233 | $24,958 | $137,275 |
| 2016 | $2,268 | $159,052 | $24,469 | $134,583 |
| 2015 | $2,075 | $156,662 | $24,101 | $132,561 |
| 2014 | $2,018 | $153,593 | $23,629 | $129,964 |
Source: Public Records
Map
Nearby Homes
- 377 S Mount Vernon Ave
- 1290 Walnut St
- 1177 W Congress St Unit 45
- 1366 Walnut St
- 192 S Eureka Ave
- 1170 W Congress St
- 1105 W Congress St
- 1099 W Congress St
- 987 W Rialto Ave
- 136 N J St
- 1475 N Holly Ave
- 1329 W 3rd St
- 410 E Citrus St
- 210 Kendall Ave
- 1948 Hunter Rd
- 151 S Muscott St
- 895 W 2nd St
- 1953 N 8th St
- 371 W Mill St
- 1338 N Mount Vernon Ave