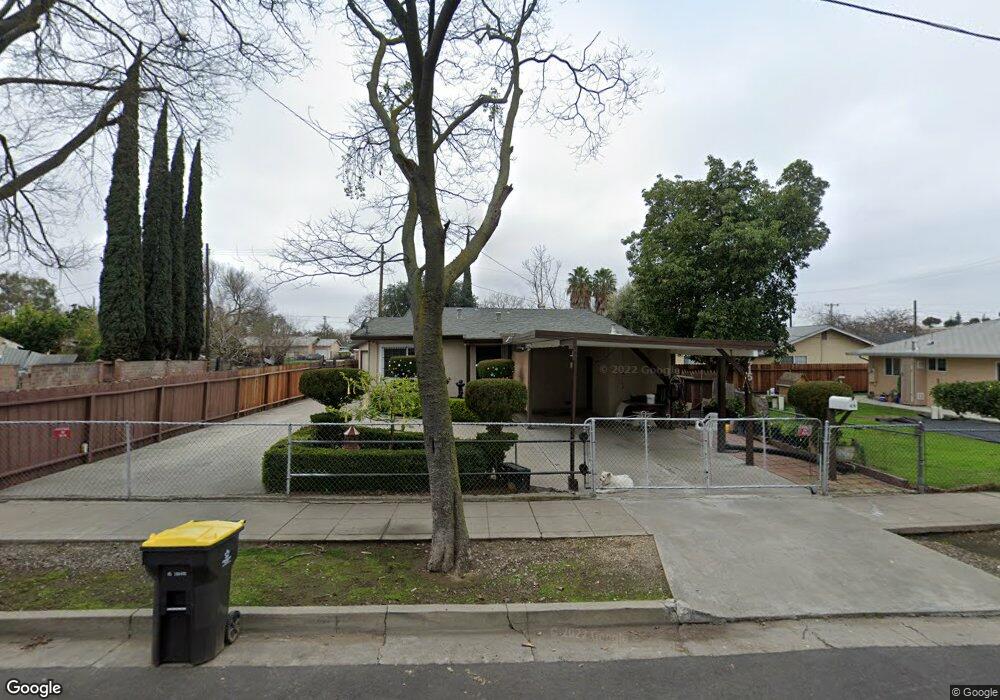
415 S San Jose St Stockton, CA 95203
Seaport NeighborhoodEstimated Value: $244,000 - $378,000
3
Beds
1
Bath
1,312
Sq Ft
$233/Sq Ft
Est. Value
About This Home
This home is located at 415 S San Jose St, Stockton, CA 95203 and is currently estimated at $306,285, approximately $233 per square foot. 415 S San Jose St is a home located in San Joaquin County with nearby schools including George Washington Elementary School, San Joaquin Elementary School, and John Marshall Elementary School.
Ownership History
Date
Name
Owned For
Owner Type
Purchase Details
Closed on
Mar 22, 2008
Sold by
Paniagua Antonio and Paniagua Juana
Bought by
Paniagua Jesus and Montecino Maria C
Current Estimated Value
Create a Home Valuation Report for This Property
The Home Valuation Report is an in-depth analysis detailing your home's value as well as a comparison with similar homes in the area
Home Values in the Area
Average Home Value in this Area
Purchase History
| Date | Buyer | Sale Price | Title Company |
|---|---|---|---|
| Paniagua Jesus | -- | None Available |
Source: Public Records
Tax History Compared to Growth
Tax History
| Year | Tax Paid | Tax Assessment Tax Assessment Total Assessment is a certain percentage of the fair market value that is determined by local assessors to be the total taxable value of land and additions on the property. | Land | Improvement |
|---|---|---|---|---|
| 2025 | $847 | $56,000 | $15,923 | $40,077 |
| 2024 | $832 | $54,903 | $15,611 | $39,292 |
| 2023 | $813 | $53,827 | $15,305 | $38,522 |
| 2022 | $683 | $52,772 | $15,005 | $37,767 |
| 2021 | $656 | $51,738 | $14,711 | $37,027 |
| 2020 | $668 | $51,209 | $14,561 | $36,648 |
| 2019 | $666 | $50,206 | $14,276 | $35,930 |
| 2018 | $654 | $49,223 | $13,997 | $35,226 |
| 2017 | $620 | $48,259 | $13,723 | $34,536 |
| 2016 | $630 | $47,312 | $13,454 | $33,858 |
| 2014 | $602 | $45,689 | $12,993 | $32,696 |
Source: Public Records
Map
Nearby Homes
- 510- S Pershing Ave
- 519 W Scotts Ave
- 1661 W Hazelton Ave
- 1765 W Sonora St
- 348 S Los Angeles Ave
- 309 S Los Angeles Ave
- 20 S Los Angeles Ave
- 520 W Jackson St
- 525 W Fremont St
- 416 W Jackson St
- 727 N Stockton St
- 725 W Park St
- 715 W Park St
- 720 W Flora St
- 519 N Monroe St
- 826 N San Jose St
- 319 W Oak St
- 522-528 N Van Buren St
- 840 N Edison St
- 907 N Pershing Ave
- 405 S San Jose St
- 1014 W Sonora St
- 1034 W Sonora St
- 420 S Argonaut St
- 1003 W Church St
- 1015 W Church St
- 1025 W Church St
- 1054 W Sonora St
- 404 S San Jose St
- 422 S San Jose St
- 231 W Sonora St
- 1035 W Church St
- 930 W Sonora St
- 352 S Argonaut St
- 341 S San Jose St
- 405 S Argonaut St
- 352 S San Jose St
- 342 S Argonaut St
- 1103 W Church St
- 413 S Yosemite St