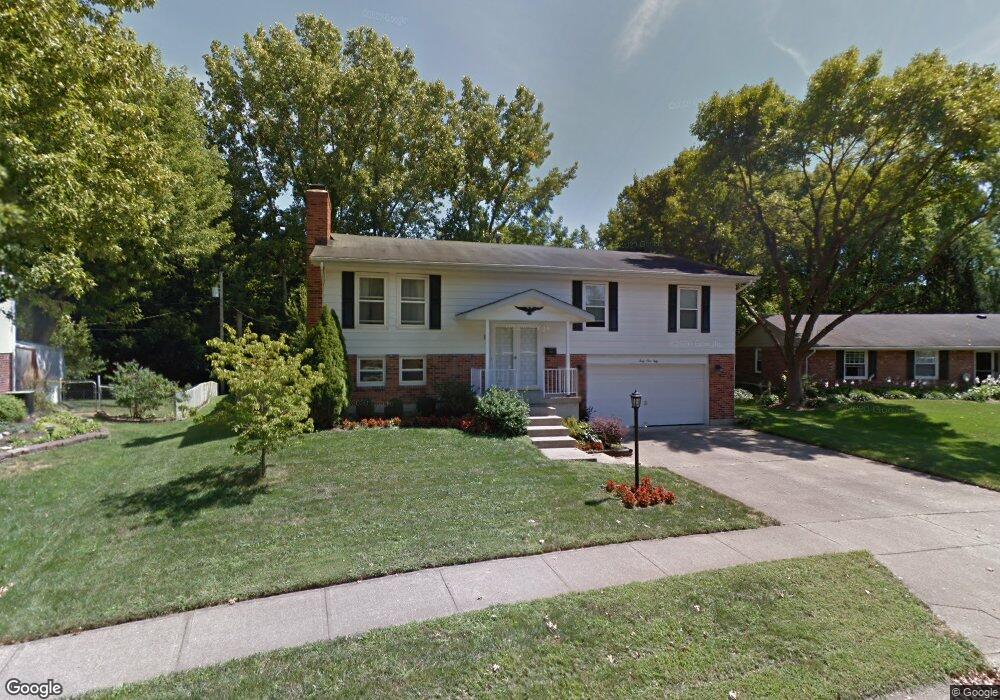
4150 Leafback Place Dayton, OH 45424
Forest Ridge Quail Hollow NeighborhoodEstimated Value: $230,000 - $258,000
3
Beds
3
Baths
1,363
Sq Ft
$179/Sq Ft
Est. Value
About This Home
This home is located at 4150 Leafback Place, Dayton, OH 45424 and is currently estimated at $244,550, approximately $179 per square foot. 4150 Leafback Place is a home located in Montgomery County with nearby schools including Stebbins High School, Pathway School of Discovery, and St. Helen Elementary School.
Ownership History
Date
Name
Owned For
Owner Type
Purchase Details
Closed on
Oct 9, 2015
Sold by
Tetlak Christopher C
Bought by
Temple Adam C
Current Estimated Value
Purchase Details
Closed on
Nov 12, 2003
Sold by
Janek Albert J and Janek Juliane M
Bought by
Tetlak Christopher C
Home Financials for this Owner
Home Financials are based on the most recent Mortgage that was taken out on this home.
Original Mortgage
$27,000
Interest Rate
6.07%
Mortgage Type
Stand Alone Second
Purchase Details
Closed on
Jun 25, 2002
Sold by
Hull Evelyn M
Bought by
Janek Albert J
Home Financials for this Owner
Home Financials are based on the most recent Mortgage that was taken out on this home.
Original Mortgage
$38,000
Interest Rate
6.91%
Purchase Details
Closed on
Jul 1, 1999
Sold by
Ann Sexton Shirley
Bought by
Hull Evelyn M
Home Financials for this Owner
Home Financials are based on the most recent Mortgage that was taken out on this home.
Original Mortgage
$66,000
Interest Rate
7.29%
Create a Home Valuation Report for This Property
The Home Valuation Report is an in-depth analysis detailing your home's value as well as a comparison with similar homes in the area
Home Values in the Area
Average Home Value in this Area
Purchase History
| Date | Buyer | Sale Price | Title Company |
|---|---|---|---|
| Temple Adam C | $116,000 | Safemark Title Agency Inc | |
| Tetlak Christopher C | $135,000 | Bridgespan Title Company | |
| Janek Albert J | $138,000 | -- | |
| Hull Evelyn M | $121,000 | -- |
Source: Public Records
Mortgage History
| Date | Status | Borrower | Loan Amount |
|---|---|---|---|
| Previous Owner | Tetlak Christopher C | $27,000 | |
| Previous Owner | Tetlak Christopher C | $108,000 | |
| Previous Owner | Janek Albert J | $38,000 | |
| Previous Owner | Hull Evelyn M | $66,000 |
Source: Public Records
Tax History
| Year | Tax Paid | Tax Assessment Tax Assessment Total Assessment is a certain percentage of the fair market value that is determined by local assessors to be the total taxable value of land and additions on the property. | Land | Improvement |
|---|---|---|---|---|
| 2025 | $2,814 | $58,300 | $13,720 | $44,580 |
| 2024 | $2,763 | $58,300 | $13,720 | $44,580 |
| 2023 | $2,763 | $58,300 | $13,720 | $44,580 |
| 2022 | $2,638 | $41,640 | $9,800 | $31,840 |
| 2021 | $2,688 | $41,640 | $9,800 | $31,840 |
| 2020 | $2,687 | $41,640 | $9,800 | $31,840 |
| 2019 | $2,671 | $36,910 | $9,800 | $27,110 |
| 2018 | $2,676 | $36,910 | $9,800 | $27,110 |
| 2017 | $2,675 | $36,910 | $9,800 | $27,110 |
| 2016 | $2,717 | $36,380 | $9,800 | $26,580 |
| 2015 | $2,831 | $36,380 | $9,800 | $26,580 |
| 2014 | $2,831 | $36,380 | $9,800 | $26,580 |
| 2012 | -- | $48,070 | $10,500 | $37,570 |
Source: Public Records
Map
Nearby Homes
- 4130 Bronze Leaf Ct
- 4914 Sweetbell Ct
- 4983 Sweetbirch Dr
- 4374 Silverberry Ave
- 4130 Beech Tree Ct
- 6953 Union Schoolhouse Rd
- 4739 Strathaven Dr
- 3800 Leatherwood Place
- 7031 Union Schoolhouse Rd
- 6030 Kay Ct
- 7121 Union Schoolhouse Rd
- 4048 Quail Bush Dr
- 4800 Silver Oak St
- 1511 Beatrice Dr
- 819 Waldrun Ave
- 5330 Gander Rd W
- 4012 Atha Ct
- 4750 Whitewood Ct
- 4221 Coach Light Trail
- 634 Mentor Ave
- 4156 Leafback Place
- 4146 Leafback Place
- 4160 Leafback Place
- 4140 Leafback Place
- 4147 Leafback Place
- 4157 Leafback Place
- 5049 Sweetleaf Dr
- 4164 Leafback Place
- 4136 Leafback Place
- 4161 Leafback Place
- 4135 Leafback Place
- 5059 Sweetleaf Dr
- 5069 Sweetleaf Dr
- 4420 Cutleaf Ct
- 4168 Leafback Place
- 5095 Sweetleaf Dr
- 4119 Leafback Place
- 5001 Sweetleaf Dr
- 5119 Sweetleaf Dr
- 5085 Sweetleaf Dr
Your Personal Tour Guide
Ask me questions while you tour the home.