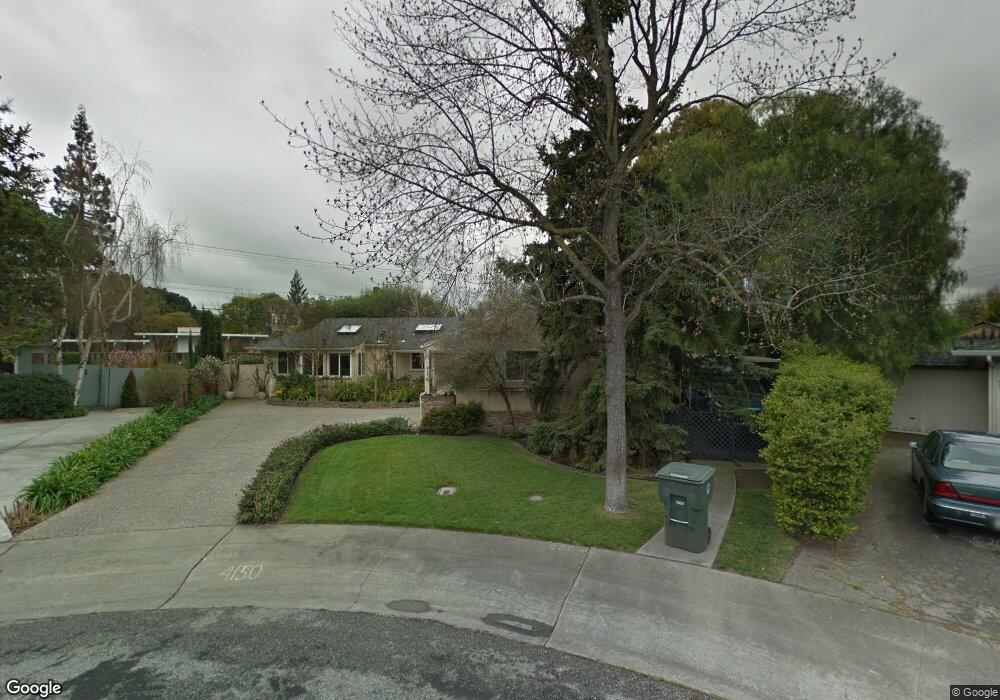
4150 Mackay Dr Palo Alto, CA 94306
Greenmeadow NeighborhoodEstimated Value: $3,493,000 - $4,154,000
3
Beds
2
Baths
1,798
Sq Ft
$2,089/Sq Ft
Est. Value
About This Home
This home is located at 4150 Mackay Dr, Palo Alto, CA 94306 and is currently estimated at $3,756,343, approximately $2,089 per square foot. 4150 Mackay Dr is a home located in Santa Clara County with nearby schools including Fairmeadow Elementary School, Jane Lathrop Stanford Middle School, and Henry M. Gunn High School.
Ownership History
Date
Name
Owned For
Owner Type
Purchase Details
Closed on
Jul 23, 2020
Sold by
Delong Lisa and Khan Noman
Bought by
Delong Lisa M and Khan Noman Q
Current Estimated Value
Purchase Details
Closed on
Dec 14, 2012
Sold by
Swanson Karin Eleanor
Bought by
Delong Lisa and Khan Noman
Purchase Details
Closed on
Oct 4, 2011
Sold by
Delong Charles C
Bought by
Delong Md C C
Home Financials for this Owner
Home Financials are based on the most recent Mortgage that was taken out on this home.
Original Mortgage
$270,000
Interest Rate
4.15%
Mortgage Type
New Conventional
Purchase Details
Closed on
Jul 27, 2004
Sold by
Delong Charles C
Bought by
Delong Md C C
Home Financials for this Owner
Home Financials are based on the most recent Mortgage that was taken out on this home.
Original Mortgage
$300,000
Interest Rate
6.24%
Mortgage Type
New Conventional
Purchase Details
Closed on
Feb 5, 2004
Sold by
Delong Charles Coggeshall
Bought by
Delong Md C C
Create a Home Valuation Report for This Property
The Home Valuation Report is an in-depth analysis detailing your home's value as well as a comparison with similar homes in the area
Home Values in the Area
Average Home Value in this Area
Purchase History
| Date | Buyer | Sale Price | Title Company |
|---|---|---|---|
| Delong Lisa M | -- | None Available | |
| Delong Lisa | $913,000 | Chicago Title Company | |
| Delong Md C C | -- | Chicago Title | |
| Delong Charles C | -- | Chicago Title Company | |
| Delong Md C C | -- | North American Title Company | |
| Delong Charles C | -- | North American Title Company | |
| Delong Md C C | -- | -- |
Source: Public Records
Mortgage History
| Date | Status | Borrower | Loan Amount |
|---|---|---|---|
| Previous Owner | Delong Charles C | $270,000 | |
| Previous Owner | Delong Charles C | $300,000 |
Source: Public Records
Tax History Compared to Growth
Tax History
| Year | Tax Paid | Tax Assessment Tax Assessment Total Assessment is a certain percentage of the fair market value that is determined by local assessors to be the total taxable value of land and additions on the property. | Land | Improvement |
|---|---|---|---|---|
| 2025 | $25,117 | $2,093,207 | $1,731,621 | $361,586 |
| 2024 | $25,117 | $2,052,165 | $1,697,668 | $354,497 |
| 2023 | $24,747 | $2,011,928 | $1,664,381 | $347,547 |
| 2022 | $24,460 | $1,972,480 | $1,631,747 | $340,733 |
| 2021 | $23,978 | $1,933,804 | $1,599,752 | $334,052 |
| 2020 | $23,486 | $1,913,976 | $1,583,349 | $330,627 |
| 2019 | $23,227 | $1,876,448 | $1,552,303 | $324,145 |
| 2018 | $22,593 | $1,839,656 | $1,521,866 | $317,790 |
| 2017 | $22,197 | $1,803,585 | $1,492,026 | $311,559 |
| 2016 | $21,614 | $1,768,221 | $1,462,771 | $305,450 |
| 2015 | $21,403 | $1,741,661 | $1,440,799 | $300,862 |
| 2014 | $20,953 | $1,707,545 | $1,412,576 | $294,969 |
Source: Public Records
Map
Nearby Homes
- 444 San Antonio Rd Unit 1A
- 181 Del Medio Ave Unit 307
- 278 Monroe Dr Unit 17
- 432 Victory Ave
- 2483 Whitney Dr
- 103 Whits Rd
- 2474 Alvin St
- 4225 Park Blvd
- 49 Showers Dr Unit J317
- 49 Showers Dr Unit D460
- 49 Showers Dr Unit E151
- 2524 W Middlefield Rd Unit 2
- 777 San Antonio Rd Unit 93
- 342 Carolina Ln
- 4206 Rickeys Way Unit C
- 2375 Adele Ave
- 3946 Louis Rd
- 795 E Charleston Rd
- 26 Roosevelt Cir
- 4250 El Camino Real Unit B120
- 4140 Mackay Dr
- 4135 Briarwood Way
- 4160 Mackay Dr
- 256 Ferne Ave
- 4123 Briarwood Way
- 4147 Briarwood Way
- 272 Ferne Ave
- 4130 Mackay Dr
- 4170 Mackay Dr
- 288 Ferne Ave
- 4107 Briarwood Way
- 4159 Briarwood Way
- 4180 Mackay Dr
- 306 Ferne Ave
- 4177 Briarwood Way
- 4120 Mackay Dr
- 4190 Mackay Dr
- 263 Fairfield Ct
- 4136 Briarwood Way
- 4124 Briarwood Way