NOT LISTED FOR SALE

4154 Lantern Ln Saint Paul, MN 55123

Estimated Value: $509,000 - $546,000

3 Beds
3 Baths
1,988 Sq Ft
$263/Sq Ft Est. Value

Last Sold August 30, 2013

Last sale price $302,500 $152 Per Sq Ft

Est. 73% increase in value since last sale

Current estimated payment $3,176/month

About This Home

As of August 2013

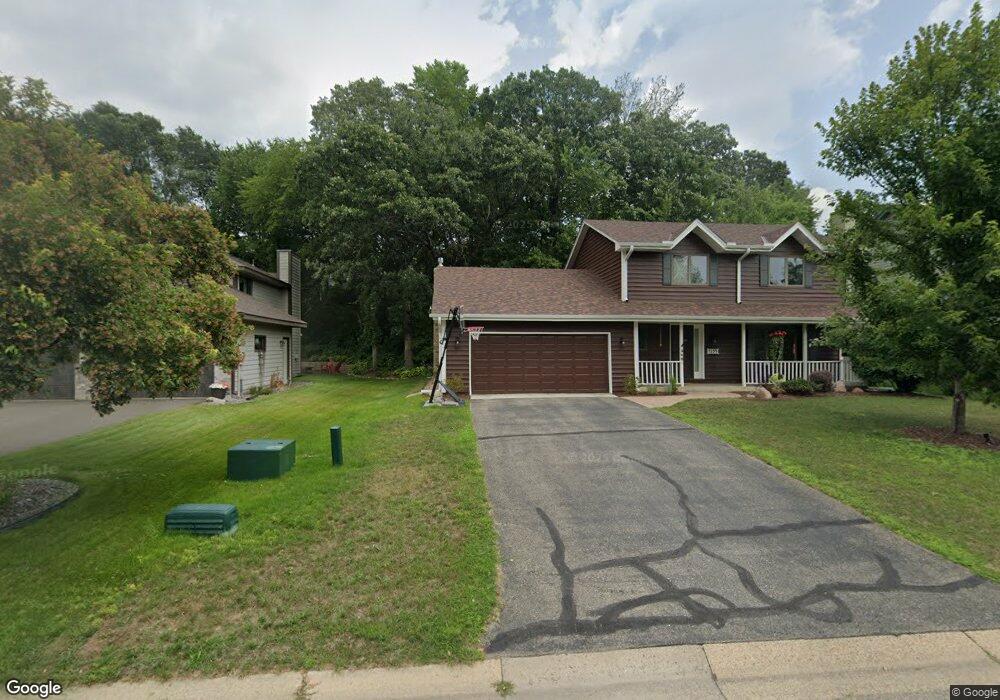
Meticulously maintained 2 stry in a great neighborhood. With newer Cambria counters, SS appliances, beautiful hardwood floors, fireplace, spacious rooms, awesome 3 season porch, irrigation system, private back yard. This is a must see!!!

Ownership History

Date Name Owned For Owner Type

Purchase Details

Listed on
Jun 24, 2013
Closed on
Aug 30, 2013
Sold by
Bland Thomas M and Bland Tara M
Bought by
Gulbranson Hersk Kimberly A and Hersk Scott B G
Seller's Agent
Debbie Johnson
Edina Realty, Inc.
Buyer's Agent
Alena Temple
Boardwalk Realty Inc
List Price
$294,900
Sold Price
$302,500
Premium/Discount to List
$7,600
2.58%
Current Estimated Value
$523,702

Home Financials for this Owner

Home Financials are based on the most recent Mortgage that was taken out on this home.
Estimated Appreciation
$221,202
Avg. Annual Appreciation
4.62%
Original Mortgage
$242,000
Outstanding Balance
$179,799
Interest Rate
4.29%
Mortgage Type
New Conventional
Estimated Equity
$343,903
Source: Public Records

Range of Values:

Collateral Analytics

Collateral Analytics Collateral Analytics AVMs (Automated Valuation Model) employ a number of statistical approaches combined with neighborhood-specific comparable selection guarantees the most up-to-date and precise valuations.

Not Available

Collateral Analytics does not have data for the current month. Please view the chart for historical values.

ICE

ICE Mortgage Technology ICE Mortgage Technology’s AVM (Automated Valuation Model) is a state-of-the-art online residential property valuation tool that provides a quick and accurate estimate of the value of almost any home in the U.S.

Not Available

ICE Mortgage Technology does not have data for the current month. Please view the chart for historical values.

First American

First American First American Data & Analytics’ next-generation AVM combines unrivaled data assets with a blended ensemble of valuation models to produce highly accurate, reliable valuations you can trust.

Not Available

First American does not have data for the current month. Please view the chart for historical values.

Quantarium

Quantarium Quantarium’s valuation service, repeatedly proven the industry’s most accurate and comprehensive, is supercharged with a self-learning and auto-tuning AI engine that continually becomes smarter and more accurate as it processes daily inputs from the industry’s leading RE data lake.

Not Available

Quantarium does not have data for the current month. Please view the chart for historical values.

Average Value
Not Available
List Price
Sold Price
Create a Home Valuation Report for This Property
The Home Valuation Report is an in-depth analysis detailing your home's value as well as a comparison with similar homes in the area

Home Values in the Area

Source: Public Records

Average Home Value in this Area


Source: Public Records

Purchase History

Date Buyer Sale Price Title Company
Gulbranson Hersk Kimberly A $302,500 Stewart Title Of Minnesota
Source: Public Records

Mortgage History

Date Status Borrower Loan Amount
Open Gulbranson Hersk Kimberly A $242,000
Source: Public Records

Property History

Date Event Price List to Sale Price per Sq Ft Prior Sale
08/30/2013 08/30/13 Sold $302,500 +2.6% $102 / Sq Ft View Prior Sale
07/09/2013 07/09/13 Pending -- -- --
06/24/2013 06/24/13 For Sale $294,900 -- $100 / Sq Ft

Tax History Compared to Growth

Source: Public Records

Tax History

Year Tax Paid Tax Assessment Tax Assessment Total Assessment is a certain percentage of the fair market value that is determined by local assessors to be the total taxable value of land and additions on the property. Land Improvement
2024 $4,900 $472,900 $119,500 $353,400
2023 $4,900 $451,100 $119,900 $331,200
2022 $4,318 $435,500 $119,500 $316,000
2021 $4,088 $385,900 $103,900 $282,000
2020 $4,126 $358,400 $99,000 $259,400
2019 $3,880 $352,300 $94,200 $258,100
2018 $3,550 $349,400 $89,800 $259,600
2017 $3,635 $312,200 $85,500 $226,700
2016 $3,657 $305,400 $81,400 $224,000
2015 $3,640 $294,774 $78,774 $216,000
2014 -- $298,589 $76,755 $221,834
2013 -- $256,515 $68,436 $188,079
Source: Public Records

Agents Affiliated with this Home

See All Agents

Map