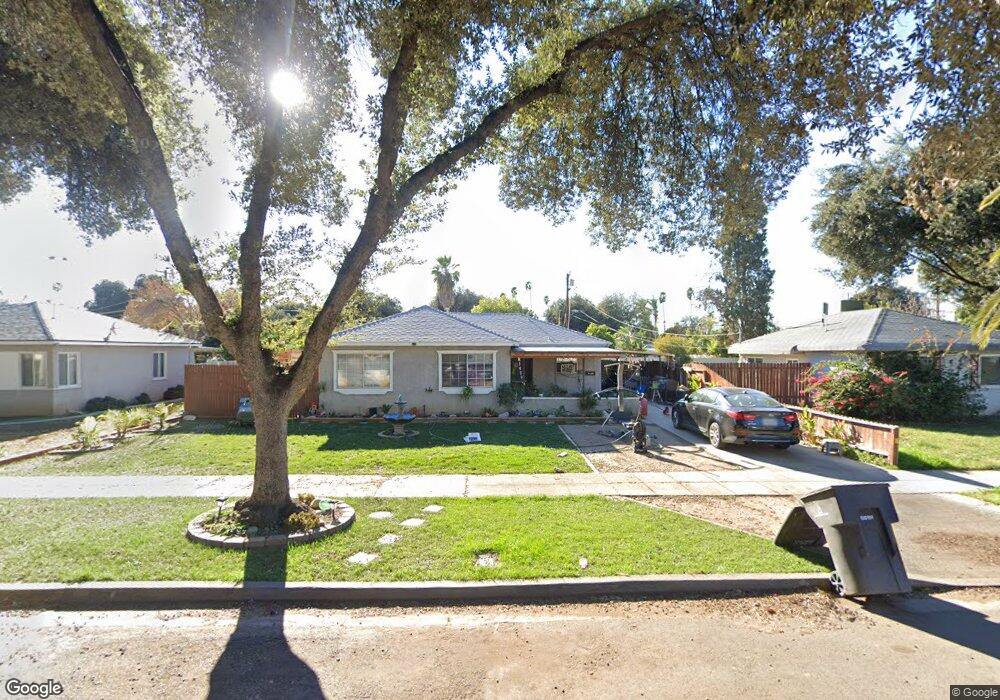
4156 Canterbury Rd Riverside, CA 92504
Ramona NeighborhoodEstimated Value: $475,863 - $515,000
3
Beds
1
Bath
900
Sq Ft
$558/Sq Ft
Est. Value
About This Home
This home is located at 4156 Canterbury Rd, Riverside, CA 92504 and is currently estimated at $502,216, approximately $558 per square foot. 4156 Canterbury Rd is a home located in Riverside County with nearby schools including Jefferson Elementary School, Sierra Middle School, and Ramona High School.
Ownership History
Date
Name
Owned For
Owner Type
Purchase Details
Closed on
Jun 23, 2025
Sold by
Martinez Jurleen
Bought by
Medearis
Current Estimated Value
Purchase Details
Closed on
Mar 23, 2002
Sold by
Martinez Jurleen
Bought by
Martinez Jurleen
Home Financials for this Owner
Home Financials are based on the most recent Mortgage that was taken out on this home.
Original Mortgage
$75,298
Interest Rate
6.84%
Mortgage Type
FHA
Purchase Details
Closed on
Aug 25, 1999
Sold by
Hud
Bought by
Martinez Jurleen
Home Financials for this Owner
Home Financials are based on the most recent Mortgage that was taken out on this home.
Original Mortgage
$76,687
Interest Rate
7.97%
Mortgage Type
FHA
Purchase Details
Closed on
Dec 24, 1998
Sold by
Countrywide Home Loans Inc
Bought by
Hud
Purchase Details
Closed on
Dec 18, 1998
Sold by
Alfredo Banales Efrain
Bought by
Countrywide Home Loans Inc
Create a Home Valuation Report for This Property
The Home Valuation Report is an in-depth analysis detailing your home's value as well as a comparison with similar homes in the area
Home Values in the Area
Average Home Value in this Area
Purchase History
| Date | Buyer | Sale Price | Title Company |
|---|---|---|---|
| Medearis | -- | None Listed On Document | |
| Martinez Jurleen | -- | Fidelity National Title | |
| Martinez Jurleen | $75,000 | Northern Counties Title | |
| Hud | -- | Landsafe Title | |
| Countrywide Home Loans Inc | $102,881 | Landsafe Title |
Source: Public Records
Mortgage History
| Date | Status | Borrower | Loan Amount |
|---|---|---|---|
| Previous Owner | Martinez Jurleen | $75,298 | |
| Previous Owner | Martinez Jurleen | $76,687 |
Source: Public Records
Tax History Compared to Growth
Tax History
| Year | Tax Paid | Tax Assessment Tax Assessment Total Assessment is a certain percentage of the fair market value that is determined by local assessors to be the total taxable value of land and additions on the property. | Land | Improvement |
|---|---|---|---|---|
| 2025 | $1,496 | $133,225 | $54,854 | $78,371 |
| 2023 | $1,496 | $128,054 | $52,725 | $75,329 |
| 2022 | $1,463 | $125,544 | $51,692 | $73,852 |
| 2021 | $1,457 | $123,083 | $50,679 | $72,404 |
| 2020 | $1,447 | $121,822 | $50,160 | $71,662 |
| 2019 | $1,421 | $119,434 | $49,177 | $70,257 |
| 2018 | $1,394 | $117,093 | $48,213 | $68,880 |
| 2017 | $1,370 | $114,798 | $47,268 | $67,530 |
| 2016 | $1,286 | $112,548 | $46,342 | $66,206 |
| 2015 | $1,267 | $110,859 | $45,647 | $65,212 |
| 2014 | $1,255 | $108,689 | $44,753 | $63,936 |
Source: Public Records
Map
Nearby Homes
- 4136 Eileen St
- 4076 Eileen St
- 4055 Canterbury Rd
- 4165 Saint George Place
- 8240 Garfield St
- 8205 Janis St
- 8268 Garfield St
- 8239 Casa Colima Way
- 4065 Madrona Rd
- 4116 Jefferson St
- 3909 Rockingham Place
- 8235 Coleman St
- 3890 Rockingham Place
- 8434 Monteel Place
- 8204 Verbena Dr
- 7859 Sycamore Ave
- 6985 Malibu Dr
- 8084 Magnolia Ave
- 7994 Magnolia Ave
- 3765 Roslyn St
- 4146 Canterbury Rd
- 4166 Canterbury Rd
- 4136 Canterbury Rd
- 4176 Canterbury Rd
- 4155 Eileen St
- 4145 Eileen St
- 4165 Eileen St
- 4175 Eileen St
- 4135 Eileen St
- 4186 Canterbury Rd
- 4126 Canterbury Rd
- 4155 Canterbury Rd
- 4145 Canterbury Rd
- 4165 Canterbury Rd
- 4185 Eileen St
- 4125 Eileen St
- 4135 Canterbury Rd
- 4175 Canterbury Rd
- 4116 Canterbury Rd
- 4196 Canterbury Rd