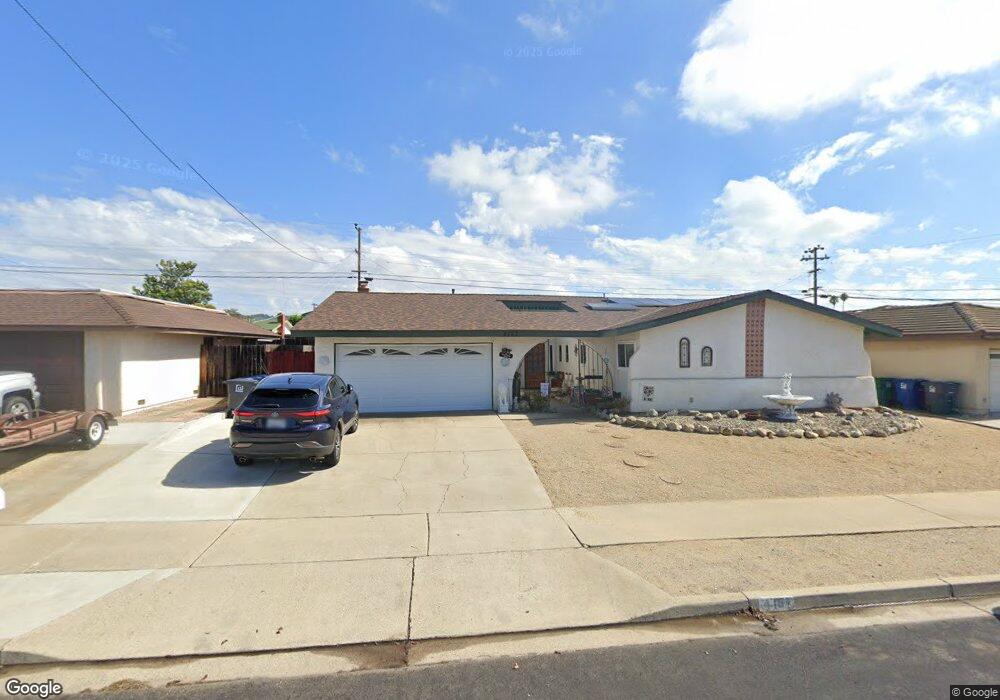
4157 Polaris Ave Unit 1 Lompoc, CA 93436
Estimated Value: $579,699 - $643,000
3
Beds
2
Baths
1,801
Sq Ft
$345/Sq Ft
Est. Value
About This Home
This home is located at 4157 Polaris Ave Unit 1, Lompoc, CA 93436 and is currently estimated at $620,925, approximately $344 per square foot. 4157 Polaris Ave Unit 1 is a home located in Santa Barbara County with nearby schools including Buena Vista Elementary School, Cabrillo High School, and Olive Grove Charter - Lompoc.
Ownership History
Date
Name
Owned For
Owner Type
Purchase Details
Closed on
Sep 14, 2001
Sold by
Va
Bought by
Douglass James A and Douglass Johnah L
Current Estimated Value
Home Financials for this Owner
Home Financials are based on the most recent Mortgage that was taken out on this home.
Original Mortgage
$241,200
Interest Rate
6.88%
Purchase Details
Closed on
Apr 26, 2000
Sold by
Eckert Theodore J and Eckert Shirley A
Bought by
Va
Create a Home Valuation Report for This Property
The Home Valuation Report is an in-depth analysis detailing your home's value as well as a comparison with similar homes in the area
Home Values in the Area
Average Home Value in this Area
Purchase History
| Date | Buyer | Sale Price | Title Company |
|---|---|---|---|
| Douglass James A | -- | -- | |
| Va | $172,000 | Chicago Title Co |
Source: Public Records
Mortgage History
| Date | Status | Borrower | Loan Amount |
|---|---|---|---|
| Previous Owner | Douglass James A | $241,200 |
Source: Public Records
Tax History Compared to Growth
Tax History
| Year | Tax Paid | Tax Assessment Tax Assessment Total Assessment is a certain percentage of the fair market value that is determined by local assessors to be the total taxable value of land and additions on the property. | Land | Improvement |
|---|---|---|---|---|
| 2025 | $3,162 | $259,151 | $97,932 | $161,219 |
| 2023 | $3,162 | $249,089 | $94,130 | $154,959 |
| 2022 | $3,115 | $244,206 | $92,285 | $151,921 |
| 2021 | $3,148 | $239,419 | $90,476 | $148,943 |
| 2020 | $3,117 | $236,965 | $89,549 | $147,416 |
| 2019 | $3,073 | $232,320 | $87,794 | $144,526 |
| 2018 | $3,032 | $227,766 | $86,073 | $141,693 |
| 2017 | $2,893 | $223,301 | $84,386 | $138,915 |
| 2016 | $2,575 | $218,924 | $82,732 | $136,192 |
| 2014 | $2,521 | $211,414 | $79,894 | $131,520 |
Source: Public Records
Map
Nearby Homes
- 252 Pegasus Ave
- 4108 Constellation Rd
- 4139 Constellation Rd Unit 2
- 129 Hercules Ave
- 113 Gemini Ave
- 4490 Sirius Ave
- 3951 Mesa Circle Dr
- 4021 Muirfield Place
- 52 Stanford Cir
- 3939 Saturn Ave
- 210 Oak Hill Dr
- 298 Saint Andrews Way
- 0 Oak Hill Dr Unit 24-783
- 240 Oak Hill Dr
- 384 Falcon Crest Dr
- 4464 Greenbrier Rd
- 445 Firestone Way
- 561 Andromeda Dr
- 579 Saint Andrews Way
- 3725 Jupiter Ave
- 4147 Polaris Ave Unit 1
- 4167 Polaris Ave
- 4158 Constellation Rd
- 4148 Constellation Rd
- 4139 Polaris Ave
- 4168 Constellation Rd
- 4175 Polaris Ave
- 224 Vega Ave
- 4140 Constellation Rd Unit 2
- 4170 Polaris Ave
- 4178 Constellation Rd
- 4131 Polaris Ave
- 4185 Polaris Ave Unit 1
- 223 Orion Ave Unit 2
- 4132 Constellation Rd
- 228 Vega Ave
- 4180 Polaris Ave
- 227 Orion Ave
- 4125 Polaris Ave
- 229 Vega Ave