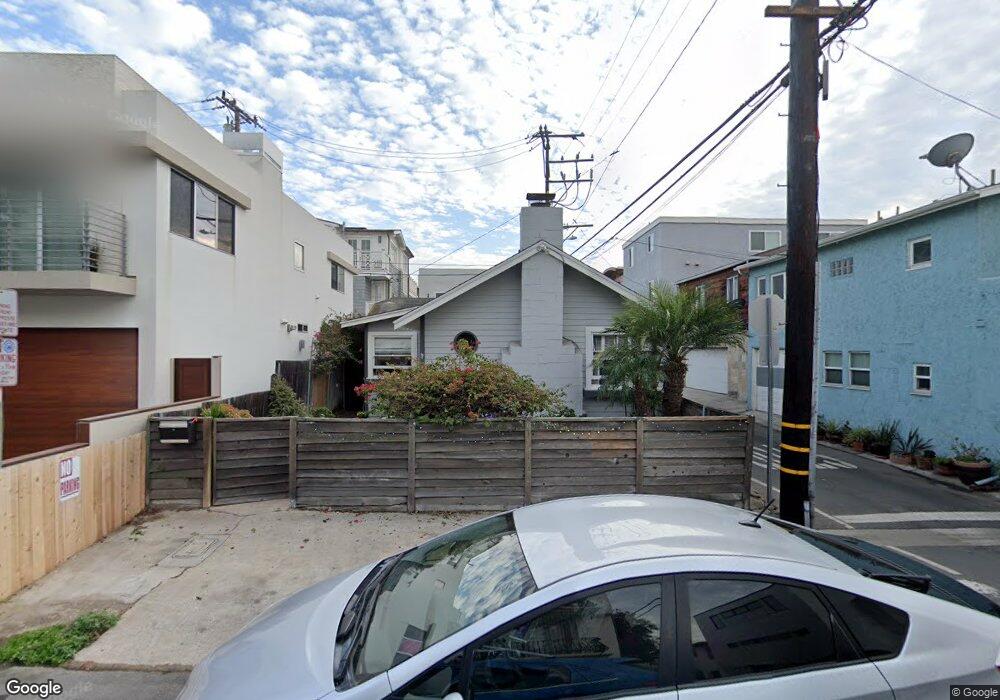
416 28th St Manhattan Beach, CA 90266
Estimated Value: $1,730,639 - $2,459,000
1
Bed
1
Bath
606
Sq Ft
$3,696/Sq Ft
Est. Value
About This Home
This home is located at 416 28th St, Manhattan Beach, CA 90266 and is currently estimated at $2,239,910, approximately $3,696 per square foot. 416 28th St is a home located in Los Angeles County with nearby schools including Grand View Elementary School, Manhattan Beach Middle School, and Mira Costa High School.
Ownership History
Date
Name
Owned For
Owner Type
Purchase Details
Closed on
Dec 7, 2018
Sold by
Estes Trevor
Bought by
The Trevor Estes Living Trust
Current Estimated Value
Create a Home Valuation Report for This Property
The Home Valuation Report is an in-depth analysis detailing your home's value as well as a comparison with similar homes in the area
Home Values in the Area
Average Home Value in this Area
Purchase History
| Date | Buyer | Sale Price | Title Company |
|---|---|---|---|
| The Trevor Estes Living Trust | -- | Ticor Title | |
| The Ian Estes Living Trust | -- | Ticor Title | |
| Estes Ian | -- | Ticor Title | |
| The Maureen Marchini Separate Property T | -- | None Available | |
| The Estes Family Trust | -- | None Available |
Source: Public Records
Tax History
| Year | Tax Paid | Tax Assessment Tax Assessment Total Assessment is a certain percentage of the fair market value that is determined by local assessors to be the total taxable value of land and additions on the property. | Land | Improvement |
|---|---|---|---|---|
| 2025 | $2,532 | $186,815 | $160,796 | $26,019 |
| 2024 | $2,532 | $183,153 | $157,644 | $25,509 |
| 2023 | $2,444 | $179,562 | $154,553 | $25,009 |
| 2022 | $2,409 | $176,042 | $151,523 | $24,519 |
| 2021 | $2,433 | $172,591 | $148,552 | $24,039 |
| 2020 | $2,413 | $170,822 | $147,029 | $23,793 |
| 2019 | $2,377 | $167,474 | $144,147 | $23,327 |
| 2018 | $2,312 | $164,191 | $141,321 | $22,870 |
| 2016 | $1,964 | $157,817 | $135,834 | $21,983 |
| 2015 | $1,926 | $155,447 | $133,794 | $21,653 |
| 2014 | $1,910 | $152,403 | $131,174 | $21,229 |
Source: Public Records
Map
Nearby Homes
- 2907 Crest Dr
- 323 31st St
- 436 32nd St
- 316 32nd St
- 2407 Manhattan Ave
- 2215 Alma Ave
- 2420 The Strand
- 3216 Highland Ave
- 3208 Manhattan Ave
- 330 34th Place
- 2208 The Strand
- 2200 The Strand Unit A
- 2200 The Strand Unit B
- 320 35th St
- 592 33rd St
- 2007 Highland Ave
- 612 33rd St
- 3520 Alma Ave
- 113 35th St
- 3601 Bayview Dr
Your Personal Tour Guide
Ask me questions while you tour the home.