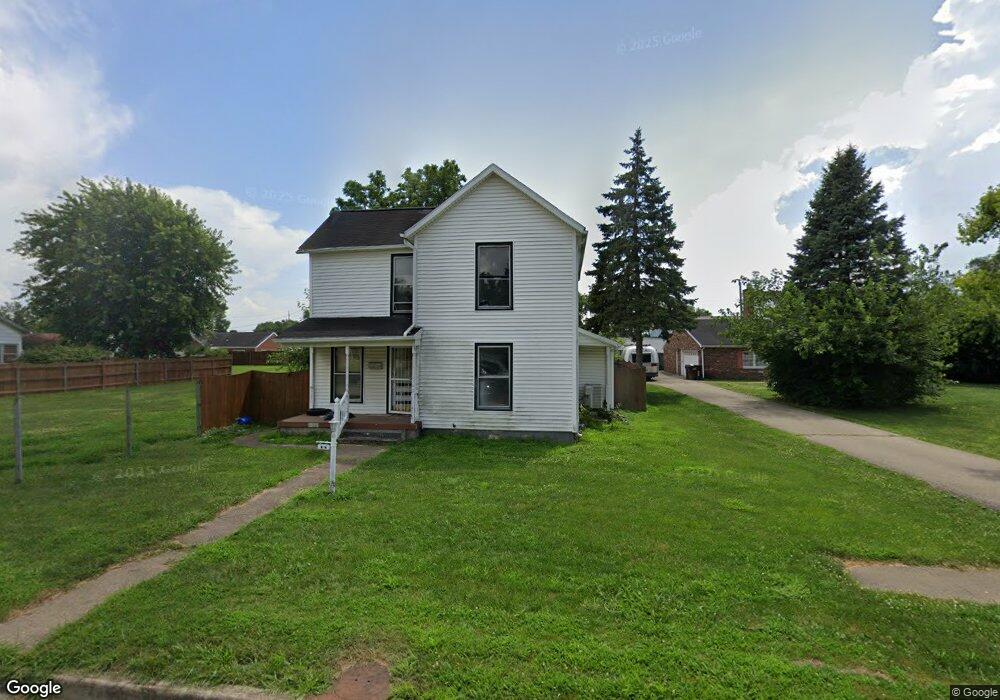
416 Forest Ave Franklin, OH 45005
Estimated Value: $176,000 - $181,000
3
Beds
1
Bath
1,527
Sq Ft
$117/Sq Ft
Est. Value
About This Home
This home is located at 416 Forest Ave, Franklin, OH 45005 and is currently estimated at $178,846, approximately $117 per square foot. 416 Forest Ave is a home located in Warren County with nearby schools including Franklin High School.
Ownership History
Date
Name
Owned For
Owner Type
Purchase Details
Closed on
Jan 21, 2026
Sold by
Blake Scott A and Blake Doris K
Bought by
Blake Jessica D
Current Estimated Value
Purchase Details
Closed on
Aug 15, 2018
Sold by
Waverly Estates Llc
Bought by
Blake Scott A and Blake Doris K
Purchase Details
Closed on
Mar 9, 2018
Sold by
Us Bank Na
Bought by
Waverly Estate Llc
Purchase Details
Closed on
Jul 11, 2017
Sold by
Blake Glenn E
Bought by
U S Bank National Association
Purchase Details
Closed on
Mar 20, 2017
Sold by
U.S Bank National
Bought by
Waverly Estates Llc
Home Financials for this Owner
Home Financials are based on the most recent Mortgage that was taken out on this home.
Interest Rate
4.3%
Purchase Details
Closed on
Jun 27, 2013
Sold by
Blake Glenna P and Blake Glenn E
Bought by
Blake Jessica D
Purchase Details
Closed on
May 14, 1986
Sold by
Eisenmenger Beatrice L and Eisenmenger Beatrice L
Bought by
Blake and Blake Glenna P
Create a Home Valuation Report for This Property
The Home Valuation Report is an in-depth analysis detailing your home's value as well as a comparison with similar homes in the area
Home Values in the Area
Average Home Value in this Area
Purchase History
| Date | Buyer | Sale Price | Title Company |
|---|---|---|---|
| Blake Jessica D | -- | None Listed On Document | |
| Blake Scott A | $46,000 | None Available | |
| Waverly Estate Llc | -- | -- | |
| U S Bank National Association | $46,667 | None Available | |
| Waverly Estates Llc | $39,036 | -- | |
| Blake Jessica D | -- | None Available | |
| Blake | $18,500 | -- |
Source: Public Records
Mortgage History
| Date | Status | Borrower | Loan Amount |
|---|---|---|---|
| Previous Owner | Waverly Estates Llc | -- |
Source: Public Records
Tax History
| Year | Tax Paid | Tax Assessment Tax Assessment Total Assessment is a certain percentage of the fair market value that is determined by local assessors to be the total taxable value of land and additions on the property. | Land | Improvement |
|---|---|---|---|---|
| 2025 | $2,352 | $43,870 | $10,510 | $33,360 |
| 2024 | $2,352 | $43,870 | $10,510 | $33,360 |
| 2023 | $2,009 | $33,999 | $6,958 | $27,041 |
| 2022 | $1,993 | $33,999 | $6,958 | $27,041 |
| 2021 | $1,803 | $33,999 | $6,958 | $27,041 |
| 2020 | $1,756 | $27,199 | $5,565 | $21,634 |
| 2019 | $1,546 | $27,199 | $5,565 | $21,634 |
| 2018 | $1,548 | $27,199 | $5,565 | $21,634 |
| 2017 | $1,179 | $26,590 | $5,523 | $21,067 |
| 2016 | $1,363 | $26,590 | $5,523 | $21,067 |
| 2015 | $1,153 | $26,590 | $5,523 | $21,067 |
| 2014 | $1,014 | $26,590 | $5,520 | $21,070 |
| 2013 | $871 | $29,770 | $6,180 | $23,590 |
Source: Public Records
Map
Nearby Homes
- 410 Park Ave
- 509 Forest Ave
- 511 Forest Ave
- 1512 Knightsbridge Ct
- 616 Lake Ave
- 309 Oxford Rd
- 712 Abney Ln
- 3 Chestnut St
- 533 Spring Ave
- 730 Park Ave
- 231 Lynn St
- 45 W 3rd St
- 5 S River St
- 0 E 4th St
- 527 S Main St
- 1200 Riley Blvd
- 202 E 2nd St
- 853 S River St
- 0 Victoria Dr Unit 942075
- 0 Victoria Dr Unit 1852824
- 420 Forest Ave
- 412 Forest Ave
- 422 1/2 Forest Ave
- 410 Forest Ave
- 422 Forest Ave
- 424 Forest Ave
- 408 Forest Ave
- 303 Maple St
- 417 Forest Ave
- 415 Forest Ave
- 413 Forest Ave
- 419 Forest Ave
- 423 Forest Ave Unit 10
- 423 Forest Ave
- 323 Maple St
- 223 Maple St
- 316 Forest Ave
- 213 Pine St
- 310 Maple St
- 310 Forest Ave
Your Personal Tour Guide
Ask me questions while you tour the home.