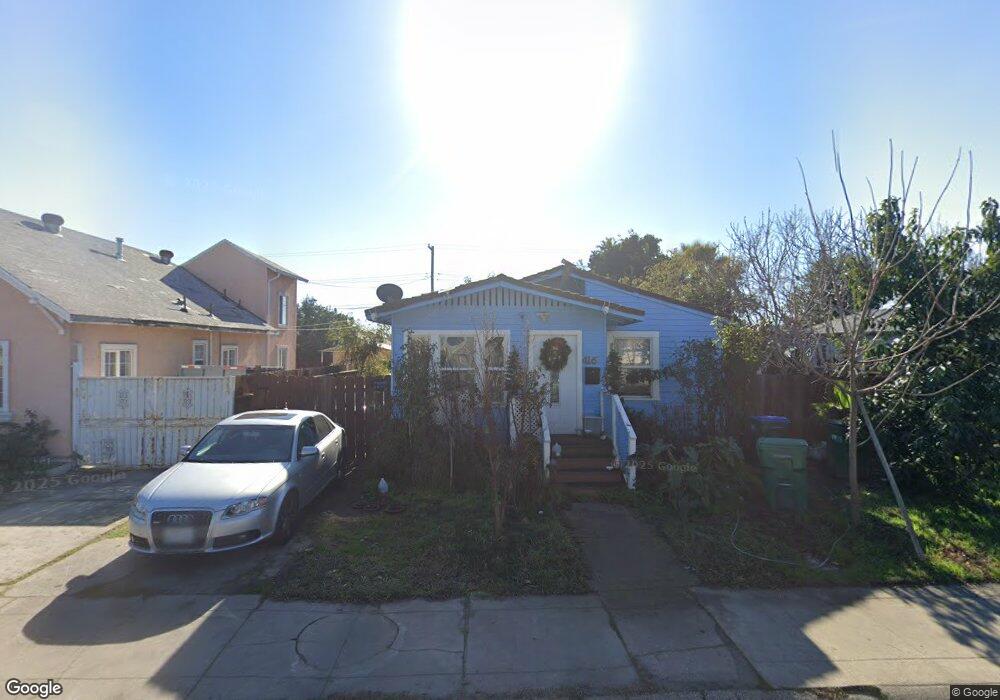
416 Maple St Lodi, CA 95240
Downtown Lodi NeighborhoodEstimated Value: $256,000 - $320,000
2
Beds
1
Bath
818
Sq Ft
$351/Sq Ft
Est. Value
About This Home
This home is located at 416 Maple St, Lodi, CA 95240 and is currently estimated at $287,195, approximately $351 per square foot. 416 Maple St is a home located in San Joaquin County with nearby schools including Heritage Elementary School, Lodi Middle School, and Tokay High School.
Ownership History
Date
Name
Owned For
Owner Type
Purchase Details
Closed on
Feb 22, 2007
Sold by
Maldonado Cutberto Pineda
Bought by
Maldonado Cutberto Pineda and Pineda Dalia
Current Estimated Value
Home Financials for this Owner
Home Financials are based on the most recent Mortgage that was taken out on this home.
Original Mortgage
$187,500
Outstanding Balance
$112,616
Interest Rate
6.21%
Mortgage Type
New Conventional
Estimated Equity
$174,579
Purchase Details
Closed on
Jun 25, 1999
Sold by
Pineda Dalia
Bought by
Maldonado Cutberto Pineda
Home Financials for this Owner
Home Financials are based on the most recent Mortgage that was taken out on this home.
Original Mortgage
$50,440
Interest Rate
7.4%
Purchase Details
Closed on
Nov 19, 1998
Sold by
Muhammad Hakmat
Bought by
The Pooling & Servicing Agreement
Create a Home Valuation Report for This Property
The Home Valuation Report is an in-depth analysis detailing your home's value as well as a comparison with similar homes in the area
Home Values in the Area
Average Home Value in this Area
Purchase History
| Date | Buyer | Sale Price | Title Company |
|---|---|---|---|
| Maldonado Cutberto Pineda | -- | Alliance Title Company | |
| Maldonado Cutberto Pineda | -- | First American Title Co | |
| Maldonado Cutberto Pineda | $52,000 | First American Title Co | |
| The Pooling & Servicing Agreement | $73,815 | Fidelity National Title Co |
Source: Public Records
Mortgage History
| Date | Status | Borrower | Loan Amount |
|---|---|---|---|
| Open | Maldonado Cutberto Pineda | $187,500 | |
| Closed | Maldonado Cutberto Pineda | $50,440 |
Source: Public Records
Tax History
| Year | Tax Paid | Tax Assessment Tax Assessment Total Assessment is a certain percentage of the fair market value that is determined by local assessors to be the total taxable value of land and additions on the property. | Land | Improvement |
|---|---|---|---|---|
| 2025 | $887 | $79,910 | $46,102 | $33,808 |
| 2024 | $863 | $78,345 | $45,199 | $33,146 |
| 2023 | $847 | $76,810 | $44,313 | $32,497 |
| 2022 | $828 | $75,305 | $43,445 | $31,860 |
| 2021 | $843 | $73,830 | $42,594 | $31,236 |
| 2020 | $821 | $73,074 | $42,158 | $30,916 |
| 2019 | $804 | $71,642 | $41,332 | $30,310 |
| 2018 | $793 | $70,238 | $40,522 | $29,716 |
| 2017 | $776 | $68,862 | $39,728 | $29,134 |
| 2016 | $728 | $67,512 | $38,949 | $28,563 |
| 2014 | $712 | $65,196 | $37,613 | $27,583 |
Source: Public Records
Map
Nearby Homes
- 433 Cherry St
- 333 Cherry St
- 513 Harold St
- 312 Cherry St
- 834 S Washington St
- 1000 S Central Ave
- 416 Concord St
- 325 Cypress St
- 220 E Lodi Ave
- 320 Acacia St
- 517 S Sacramento St
- 709 S School St
- 7 Chestnut St
- 20075 E Kettleman Ln
- 441 Elgin Ave
- 914 S Pleasant Ave
- 421 E Elm St
- 113 N Cherokee Ln
- 536 E Locust St
- 121 N Central Ave
Your Personal Tour Guide
Ask me questions while you tour the home.