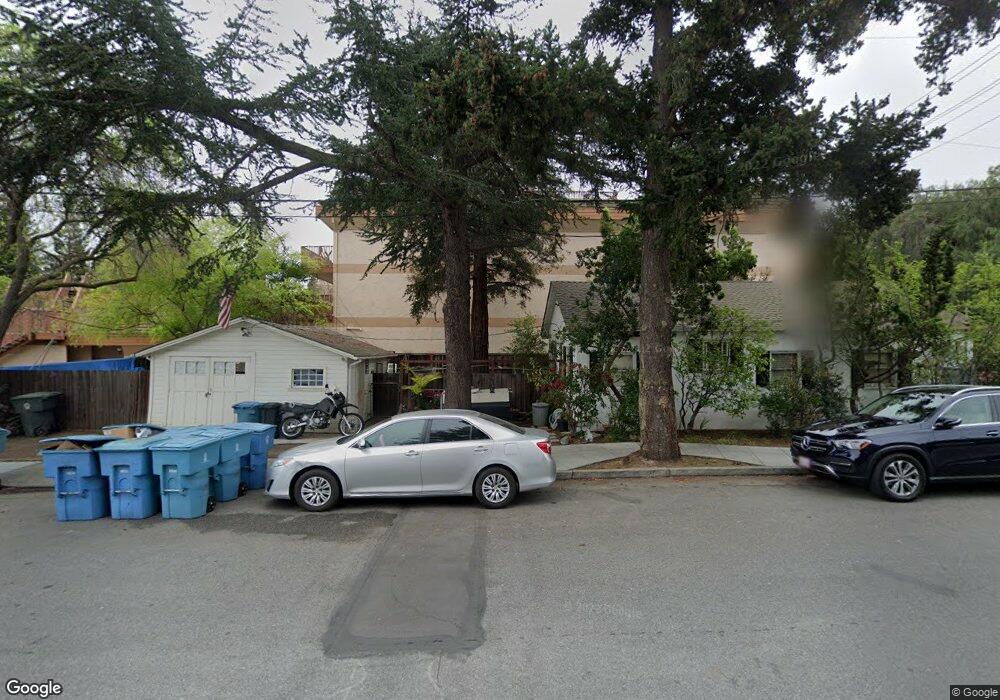
4161 El Camino Way Unit D Palo Alto, CA 94306
Charleston Meadows NeighborhoodEstimated Value: $1,118,591 - $1,555,000
2
Beds
2
Baths
1,224
Sq Ft
$1,071/Sq Ft
Est. Value
About This Home
This home is located at 4161 El Camino Way Unit D, Palo Alto, CA 94306 and is currently estimated at $1,310,398, approximately $1,070 per square foot. 4161 El Camino Way Unit D is a home located in Santa Clara County with nearby schools including Juana Briones Elementary School, Ellen Fletcher Middle, and Henry M. Gunn High School.
Ownership History
Date
Name
Owned For
Owner Type
Purchase Details
Closed on
Oct 22, 2019
Sold by
Cappelli Mark Antony and Cappelli Anne Marie
Bought by
Cappelli Mark Antony and Cappelli Anne Marie
Current Estimated Value
Purchase Details
Closed on
Mar 19, 2014
Sold by
Cappelli Mark and Cappelli Anne Marie
Bought by
Cappelli Mark A and Cappelli Anne Marie
Home Financials for this Owner
Home Financials are based on the most recent Mortgage that was taken out on this home.
Original Mortgage
$417,000
Interest Rate
4.18%
Mortgage Type
New Conventional
Purchase Details
Closed on
Sep 4, 2003
Sold by
Cappelli Mark and Caappelli Anne Marie
Bought by
Cappelli Mark and Cappelli Anne Marie
Home Financials for this Owner
Home Financials are based on the most recent Mortgage that was taken out on this home.
Original Mortgage
$70,000
Interest Rate
6.06%
Mortgage Type
Credit Line Revolving
Create a Home Valuation Report for This Property
The Home Valuation Report is an in-depth analysis detailing your home's value as well as a comparison with similar homes in the area
Home Values in the Area
Average Home Value in this Area
Purchase History
| Date | Buyer | Sale Price | Title Company |
|---|---|---|---|
| Cappelli Mark Antony | -- | None Available | |
| Cappelli Mark A | -- | Title365 National Solutions | |
| Cappelli Mark | -- | Alliance Title Company |
Source: Public Records
Mortgage History
| Date | Status | Borrower | Loan Amount |
|---|---|---|---|
| Closed | Cappelli Mark A | $417,000 | |
| Closed | Cappelli Mark | $70,000 |
Source: Public Records
Tax History Compared to Growth
Tax History
| Year | Tax Paid | Tax Assessment Tax Assessment Total Assessment is a certain percentage of the fair market value that is determined by local assessors to be the total taxable value of land and additions on the property. | Land | Improvement |
|---|---|---|---|---|
| 2025 | $4,919 | $342,590 | $120,569 | $222,021 |
| 2024 | $4,919 | $335,873 | $118,205 | $217,668 |
| 2023 | $4,843 | $329,288 | $115,888 | $213,400 |
| 2022 | $4,780 | $322,832 | $113,616 | $209,216 |
| 2021 | $4,686 | $316,503 | $111,389 | $205,114 |
| 2020 | $4,605 | $313,258 | $110,247 | $203,011 |
| 2019 | $4,549 | $307,117 | $108,086 | $199,031 |
| 2018 | $4,443 | $301,096 | $105,967 | $195,129 |
| 2017 | $4,365 | $295,193 | $103,890 | $191,303 |
| 2016 | $4,245 | $289,405 | $101,853 | $187,552 |
| 2015 | $4,198 | $285,059 | $100,324 | $184,735 |
| 2014 | $4,026 | $279,476 | $98,359 | $181,117 |
Source: Public Records
Map
Nearby Homes
- 4173 El Camino Real Unit 1
- 4206 Rickeys Way Unit C
- 4132 Thain Way
- 342 Carolina Ln
- 4225 Park Blvd
- 4250 El Camino Real Unit B120
- 717 Los Robles Ave
- 26 Roosevelt Cir
- 3888 Magnolia Dr
- 278 Monroe Dr Unit 35
- 579 Glenbrook Dr
- 645 Maybell Ave Unit A
- 4198 Cherry Oaks Place
- 3428 Alma Village Cir
- 4287 Pomona Ave
- 772 Paul Ave
- 923 Shauna Ln
- 3941 Duncan Place
- 181 Del Medio Ave Unit 307
- 3213 Alma St
- 4161 El Camino Way Unit 4161D
- 4161 El Camino Way Unit C
- 4161 El Camino Way
- 4161 El Camino Way Unit R21
- 4161 El Camino Way Unit F
- 4157 El Camino Way Unit E
- 4157 El Camino Way Unit G
- 4157 El Camino Way Unit R25
- 4157 El Camino Way Unit I
- 4157 El Camino Way Unit H
- 4157 El Camino Way Unit R23
- 4157 El Camino Way Unit F
- 4157 El Camino Way Unit D
- 4155 El Camino Way
- 4155 El Camino Way Unit Suite B
- 4155 El Camino Way Unit A
- 4155 El Camino Way Unit E
- 4155 El Camino Way Unit F
- 4155 El Camino Way Unit G
- 4155 El Camino Way Unit D