Estimated Value: $335,136 - $381,000
3
Beds
2
Baths
1,949
Sq Ft
$181/Sq Ft
Est. Value
About This Home
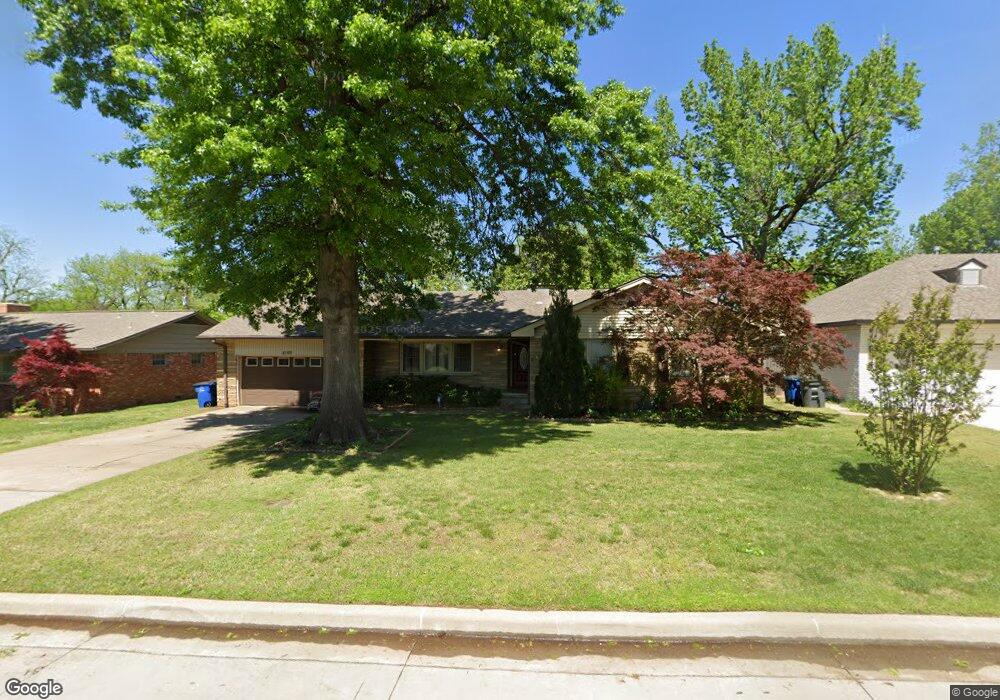
This home is located at 4165 E 49th St, Tulsa, OK 74135 and is currently estimated at $353,034, approximately $181 per square foot. 4165 E 49th St is a home located in Tulsa County with nearby schools including Patrick Henry Elementary School, Edison Preparatory School, and Thomas Edison Preparatory High School.
Ownership History
Date
Name
Owned For
Owner Type
Purchase Details
Closed on
Oct 22, 2018
Sold by
Taylor Travis and Lyman Christine Jude
Bought by
Taylor Travis Lloyd
Current Estimated Value
Purchase Details
Closed on
Nov 30, 2011
Sold by
Cooley Christopher N and Cooley Jessica L
Bought by
Taylor Travis L and Taylor Christine
Home Financials for this Owner
Home Financials are based on the most recent Mortgage that was taken out on this home.
Original Mortgage
$189,568
Interest Rate
4.03%
Mortgage Type
FHA
Create a Home Valuation Report for This Property
The Home Valuation Report is an in-depth analysis detailing your home's value as well as a comparison with similar homes in the area
Purchase History
| Date | Buyer | Sale Price | Title Company |
|---|---|---|---|
| Taylor Travis Lloyd | -- | None Available | |
| Taylor Travis L | $194,500 | Frisco Title Corporation |
Source: Public Records
Mortgage History
| Date | Status | Borrower | Loan Amount |
|---|---|---|---|
| Closed | Taylor Travis L | $189,568 |
Source: Public Records
Tax History
| Year | Tax Paid | Tax Assessment Tax Assessment Total Assessment is a certain percentage of the fair market value that is determined by local assessors to be the total taxable value of land and additions on the property. | Land | Improvement |
|---|---|---|---|---|
| 2025 | $3,792 | $28,298 | $3,661 | $24,637 |
| 2024 | $3,378 | $27,445 | $4,419 | $23,026 |
| 2023 | $3,378 | $27,616 | $4,409 | $23,207 |
| 2022 | $3,441 | $25,812 | $4,383 | $21,429 |
| 2021 | $3,306 | $25,031 | $4,250 | $20,781 |
| 2020 | $3,186 | $24,459 | $4,153 | $20,306 |
| 2019 | $3,250 | $23,718 | $4,027 | $19,691 |
| 2018 | $3,159 | $22,998 | $3,905 | $19,093 |
| 2017 | $3,057 | $23,299 | $3,956 | $19,343 |
| 2016 | $2,903 | $22,621 | $4,093 | $18,528 |
| 2015 | $2,908 | $22,621 | $4,093 | $18,528 |
| 2014 | $2,795 | $22,621 | $4,093 | $18,528 |
Source: Public Records
Map
Nearby Homes
- 4197 E 47th Place
- 4428 E 49th St
- 3749 E 48th Place
- 4171 E 46th St
- 4664 S Winston Ave
- 3707 E 47th Place
- 4704 E 46th St
- 3714 E 46th Place
- 4156 E 43rd St
- 4003 E 52nd St
- 3710 E 43rd Place
- 4118 E 41st Place
- 4121 S New Haven Place
- 4209 E 40th Place
- 3424 E 41st St
- 3931 S Oswego Ave
- 5533 S Toledo Ave
- 5518 E 46th St Unit 5518
- 5528 E 46th St Unit 9
- 3714 E 40th St
- 4159 E 49th St
- 4171 E 49th St
- 4158 E 48th Place
- 4152 E 48th Place
- 4153 E 49th St
- 4179 E 49th St
- 4146 E 48th Place
- 4166 E 48th Place
- 4166 E 49th St
- 4160 E 49th St
- 4172 E 49th St
- 4147 E 49th St
- 4154 E 49th St
- 4185 E 49th St
- 4138 E 48th Place
- 4178 E 49th St
- 4172 E 48th Place
- 4148 E 49th St
- 4184 E 49th St
- 4139 E 49th St
Your Personal Tour Guide
Ask me questions while you tour the home.