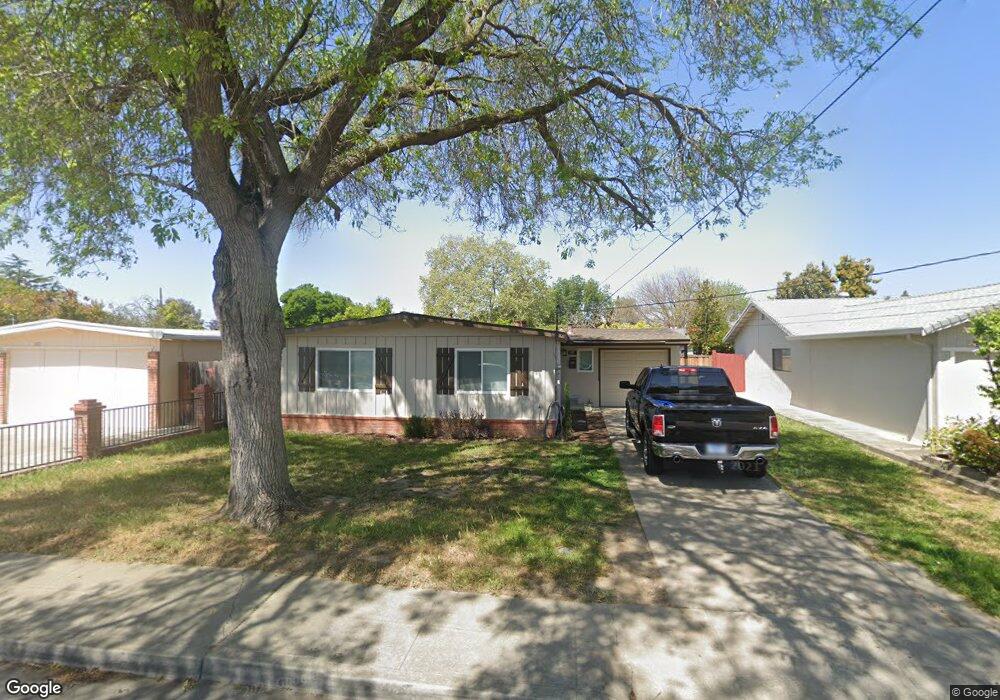
4167 Hawkins St Fremont, CA 94538
Sundale NeighborhoodEstimated Value: $1,048,557 - $1,186,000
3
Beds
1
Bath
950
Sq Ft
$1,161/Sq Ft
Est. Value
About This Home
This home is located at 4167 Hawkins St, Fremont, CA 94538 and is currently estimated at $1,103,389, approximately $1,161 per square foot. 4167 Hawkins St is a home located in Alameda County with nearby schools including John Blacow Elementary School, G.M. Walters Middle School, and John F. Kennedy High School.
Ownership History
Date
Name
Owned For
Owner Type
Purchase Details
Closed on
Nov 4, 2009
Sold by
Winter Brandi Nichole
Bought by
Declarat Winter Brandi Nichole and Declarat Brandi Nichole Winter
Current Estimated Value
Purchase Details
Closed on
Aug 3, 2006
Sold by
Denham Blanchard Janice Marie and Denham Robert William
Bought by
Blanchard Janice Marie and Survivors Trust Robert William
Purchase Details
Closed on
Jan 12, 1999
Sold by
Denham Robert W and Blanchard Janice M
Bought by
Denham Robert William and Blanchard Janice Marie
Home Financials for this Owner
Home Financials are based on the most recent Mortgage that was taken out on this home.
Original Mortgage
$85,000
Interest Rate
6.73%
Purchase Details
Closed on
Jan 8, 1999
Sold by
Denham Robert W M and Blanchard Janice M
Bought by
Denham Robert William and Blanchard Janice Marie
Home Financials for this Owner
Home Financials are based on the most recent Mortgage that was taken out on this home.
Original Mortgage
$85,000
Interest Rate
6.73%
Create a Home Valuation Report for This Property
The Home Valuation Report is an in-depth analysis detailing your home's value as well as a comparison with similar homes in the area
Home Values in the Area
Average Home Value in this Area
Purchase History
| Date | Buyer | Sale Price | Title Company |
|---|---|---|---|
| Declarat Winter Brandi Nichole | -- | None Available | |
| Winter Brandi Nichole | -- | None Available | |
| Blanchard Janice Marie | -- | None Available | |
| Denham Robert William | -- | -- | |
| Denham Robert William | -- | American Title Co |
Source: Public Records
Mortgage History
| Date | Status | Borrower | Loan Amount |
|---|---|---|---|
| Closed | Denham Robert William | $85,000 |
Source: Public Records
Tax History Compared to Growth
Tax History
| Year | Tax Paid | Tax Assessment Tax Assessment Total Assessment is a certain percentage of the fair market value that is determined by local assessors to be the total taxable value of land and additions on the property. | Land | Improvement |
|---|---|---|---|---|
| 2025 | $1,516 | $62,496 | $28,604 | $33,892 |
| 2024 | $1,516 | $61,270 | $28,043 | $33,227 |
| 2023 | $1,455 | $60,069 | $27,493 | $32,576 |
| 2022 | $1,407 | $58,891 | $26,954 | $31,937 |
| 2021 | $1,381 | $57,736 | $26,425 | $31,311 |
| 2020 | $1,287 | $57,145 | $26,155 | $30,990 |
| 2019 | $1,278 | $56,024 | $25,642 | $30,382 |
| 2018 | $1,250 | $54,926 | $25,139 | $29,787 |
| 2017 | $1,220 | $53,849 | $24,646 | $29,203 |
| 2016 | $1,185 | $52,793 | $24,163 | $28,630 |
| 2015 | $1,155 | $52,000 | $23,800 | $28,200 |
| 2014 | $1,124 | $50,982 | $23,334 | $27,648 |
Source: Public Records
Map
Nearby Homes
- 4421 Cahill St
- 4453 Porter St
- 40702 Greystone Terrace Unit 9
- 39993 Fremont Blvd Unit 102
- 4214 Providence Terrace
- 4310 Providence Terrace
- 40116 Crockett St
- 3909 Stevenson Blvd Unit 402
- 40708 Fremont Blvd
- 4463 Hyde Common Unit 306
- 40769 Squill Common
- 4555 Stevenson Blvd
- 3695 Stevenson Blvd Unit E206
- 40469 Shaw Ct
- 3583 Madison Common
- 3518 Madison Common
- 40425 Chapel Way Unit 214
- 40425 Chapel Way Unit 309
- 40696 Robin St
- 4600 Nelson St
- 4161 Hawkins St
- 4173 Hawkins St
- 40337 Monte Ct
- 4153 Hawkins St
- 4181 Hawkins St
- 4166 Hawkins St
- 40336 Pacific St
- 4147 Hawkins St
- 4160 Hawkins St
- 4172 Hawkins St
- 4187 Hawkins St
- 40338 Monte Ct
- 40329 Monte Ct
- 4152 Hawkins St
- 40282 Pacific St
- 4180 Hawkins St
- 4141 Hawkins St
- 4146 Hawkins St
- 4186 Hawkins St
- 40274 Pacific St