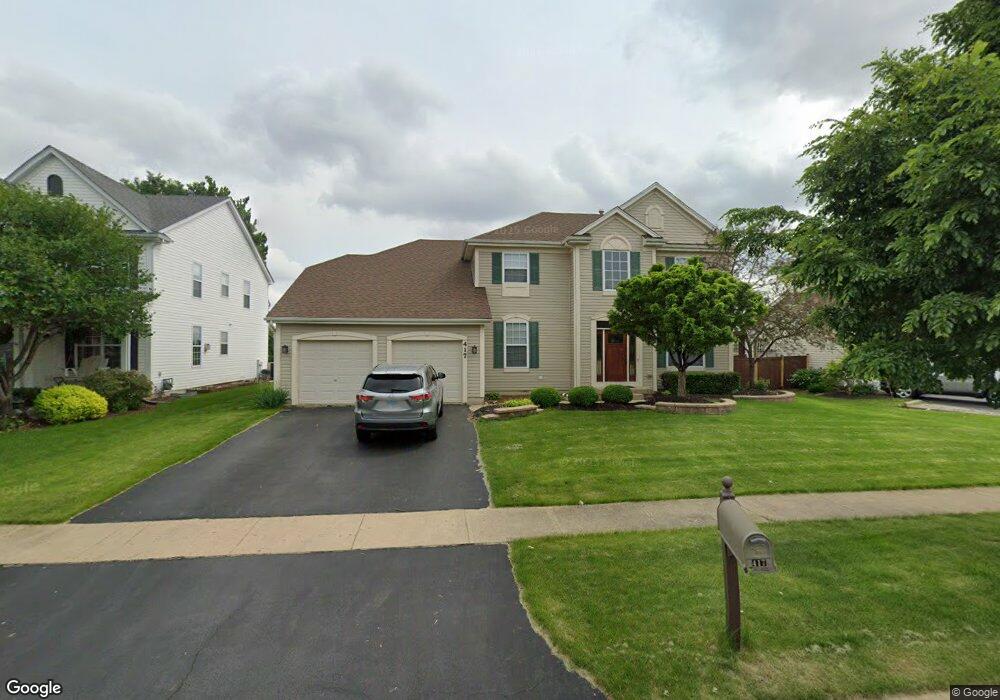
417 Arboretum Way Unit 1 Oswego, IL 60543
South Oswego NeighborhoodEstimated Value: $475,000 - $506,000
4
Beds
3
Baths
2,775
Sq Ft
$176/Sq Ft
Est. Value
About This Home
This home is located at 417 Arboretum Way Unit 1, Oswego, IL 60543 and is currently estimated at $488,021, approximately $175 per square foot. 417 Arboretum Way Unit 1 is a home located in Kendall County with nearby schools including Prairie Point Elementary School, Traughber Junior High School, and Oswego High School.
Ownership History
Date
Name
Owned For
Owner Type
Purchase Details
Closed on
Jun 29, 2017
Sold by
Lagrassa John A and Lagrassa Teresa A
Bought by
Munyaneza Jean
Current Estimated Value
Home Financials for this Owner
Home Financials are based on the most recent Mortgage that was taken out on this home.
Original Mortgage
$279,000
Outstanding Balance
$233,253
Interest Rate
4.12%
Mortgage Type
New Conventional
Estimated Equity
$254,768
Purchase Details
Closed on
Aug 26, 2003
Sold by
Wiseman Hughes Enterprises Inc
Bought by
Lagrassa John A and Lagrassa Teresa A
Home Financials for this Owner
Home Financials are based on the most recent Mortgage that was taken out on this home.
Original Mortgage
$220,805
Interest Rate
6.18%
Mortgage Type
Purchase Money Mortgage
Create a Home Valuation Report for This Property
The Home Valuation Report is an in-depth analysis detailing your home's value as well as a comparison with similar homes in the area
Home Values in the Area
Average Home Value in this Area
Purchase History
| Date | Buyer | Sale Price | Title Company |
|---|---|---|---|
| Munyaneza Jean | $310,000 | Chicago Title Insurance Co | |
| Lagrassa John A | $276,500 | Chicago Title Insurance Co |
Source: Public Records
Mortgage History
| Date | Status | Borrower | Loan Amount |
|---|---|---|---|
| Open | Munyaneza Jean | $279,000 | |
| Previous Owner | Lagrassa John A | $220,805 |
Source: Public Records
Tax History Compared to Growth
Tax History
| Year | Tax Paid | Tax Assessment Tax Assessment Total Assessment is a certain percentage of the fair market value that is determined by local assessors to be the total taxable value of land and additions on the property. | Land | Improvement |
|---|---|---|---|---|
| 2024 | $9,413 | $122,968 | $33,823 | $89,145 |
| 2023 | $8,636 | $111,789 | $30,748 | $81,041 |
| 2022 | $8,636 | $101,627 | $27,953 | $73,674 |
| 2021 | $8,672 | $98,667 | $27,139 | $71,528 |
| 2020 | $8,757 | $98,667 | $27,139 | $71,528 |
| 2019 | $8,896 | $98,667 | $27,139 | $71,528 |
| 2018 | $9,008 | $98,667 | $27,139 | $71,528 |
| 2017 | $8,752 | $91,359 | $25,129 | $66,230 |
| 2016 | $4,191 | $86,596 | $23,819 | $62,777 |
| 2015 | $8,385 | $82,867 | $22,793 | $60,074 |
| 2014 | -- | $78,177 | $21,503 | $56,674 |
| 2013 | -- | $78,966 | $21,720 | $57,246 |
Source: Public Records
Map
Nearby Homes
- 851 Claridge Dr
- 770 Dartmouth Ln
- 639 Vista Dr
- 777 Dartmouth Ln
- 673 Cumberland Ln
- 668 Cumberland Ln
- 676 Cumberland Ln
- 210 Dorset Ave
- 318 Monica Ln
- 2489 Semillon St
- 2486 Semillon St
- 2319 Hirsch Dr
- 612 Murdock Place
- 2492 Semillon St
- 2259 Riesling Rd
- 2255 Riesling Rd
- 2253 Riesling Rd
- 2501 Semillon St
- 2257 Riesling Rd
- 2251 Riesling Rd
- 419 Arboretum Way Unit 1
- 415 Arboretum Way Unit 1
- 421 Arboretum Way Unit 1
- 321 Greenwood Place Unit 1
- 418 Arboretum Way Unit 1
- 319 Greenwood Place Unit 1
- 416 Arboretum Way Unit 1
- 420 Arboretum Way Unit 1
- 423 Arboretum Way
- 414 Arboretum Way Unit 1
- 422 Arboretum Way Unit 1
- 412 Arboretum Way
- 425 Arboretum Way Unit 1
- 424 Arboretum Way
- 511 Woodland Way Unit 1
- 509 Woodland Way
- 410 Arboretum Way
- 513 Woodland Way
- 507 Woodland Way
- 515 Woodland Way