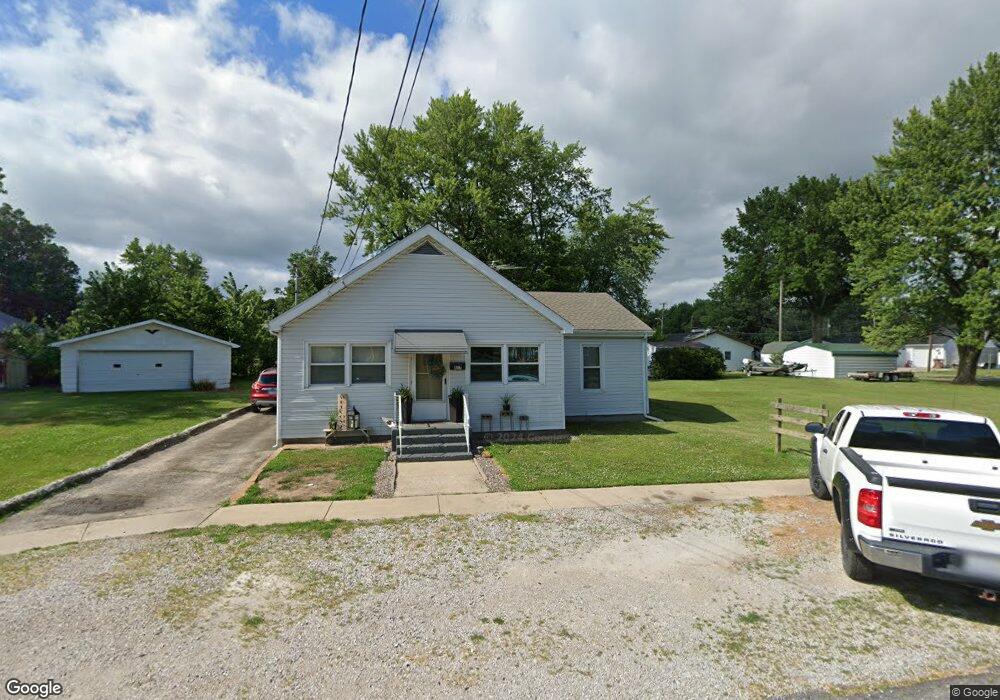
417 E Chestnut St Gillespie, IL 62033
Estimated Value: $53,137 - $145,000
Studio
--
Bath
--
Sq Ft
5,401
Sq Ft Lot
About This Home
This home is located at 417 E Chestnut St, Gillespie, IL 62033 and is currently estimated at $96,284. 417 E Chestnut St is a home located in Macoupin County with nearby schools including Ben-Gil Elementary School, Gillespie Middle School, and Gillespie High School.
Ownership History
Date
Name
Owned For
Owner Type
Purchase Details
Closed on
Oct 25, 2024
Sold by
Helvey Amanda
Bought by
Hall Trae
Current Estimated Value
Home Financials for this Owner
Home Financials are based on the most recent Mortgage that was taken out on this home.
Original Mortgage
$51,200
Outstanding Balance
$49,382
Interest Rate
5.88%
Mortgage Type
New Conventional
Estimated Equity
$46,902
Purchase Details
Closed on
Aug 29, 2022
Sold by
Price Jr Charles E
Bought by
Helvey Amanda and Hall Trae
Home Financials for this Owner
Home Financials are based on the most recent Mortgage that was taken out on this home.
Original Mortgage
$37,311
Interest Rate
5.51%
Mortgage Type
FHA
Purchase Details
Closed on
Dec 16, 2014
Sold by
Blevins Lois
Bought by
Price Charles E
Home Financials for this Owner
Home Financials are based on the most recent Mortgage that was taken out on this home.
Original Mortgage
$30,000
Interest Rate
3.3%
Mortgage Type
New Conventional
Create a Home Valuation Report for This Property
The Home Valuation Report is an in-depth analysis detailing your home's value as well as a comparison with similar homes in the area
Home Values in the Area
Average Home Value in this Area
Purchase History
| Date | Buyer | Sale Price | Title Company |
|---|---|---|---|
| Hall Trae | -- | M County Title | |
| Helvey Amanda | -- | New Title Company Name | |
| Price Charles E | $30,000 | -- |
Source: Public Records
Mortgage History
| Date | Status | Borrower | Loan Amount |
|---|---|---|---|
| Open | Hall Trae | $51,200 | |
| Previous Owner | Helvey Amanda | $37,311 | |
| Previous Owner | Price Charles E | $30,000 |
Source: Public Records
Tax History
| Year | Tax Paid | Tax Assessment Tax Assessment Total Assessment is a certain percentage of the fair market value that is determined by local assessors to be the total taxable value of land and additions on the property. | Land | Improvement |
|---|---|---|---|---|
| 2024 | $966 | $21,649 | $1,728 | $19,921 |
| 2023 | $1,322 | $20,045 | $1,600 | $18,445 |
| 2022 | $1,322 | $18,733 | $1,495 | $17,238 |
| 2021 | $1,266 | $17,507 | $1,397 | $16,110 |
| 2020 | $1,245 | $17,164 | $1,370 | $15,794 |
| 2019 | $1,251 | $16,347 | $1,305 | $15,042 |
| 2018 | $1,207 | $15,871 | $1,267 | $14,604 |
| 2017 | $1,192 | $15,231 | $1,216 | $14,015 |
| 2016 | $1,186 | $15,231 | $1,216 | $14,015 |
| 2015 | $1,205 | $15,231 | $1,216 | $14,015 |
| 2014 | $1,201 | $15,231 | $1,216 | $14,015 |
| 2013 | -- | $16,023 | $1,280 | $14,743 |
Source: Public Records
Map
Nearby Homes
- 301 Montgomery St
- 302 E Elm St
- 418 E Elm St
- 212 E Elm St
- 307 South St
- 601 Biddle St
- 705 N MacOupin St
- 811 Adams St
- 713 N MacOupin St
- 304 Francis St
- 506 W Walnut St
- 610 Rotary St
- 509 E Wilson Ave
- 208 Henrietta St
- 900 Montana St
- xxx Tortoise Trail
- 398 Dorsey Rd
- 2630 Staunton Rd
- 214 W Walnut St
- 209 S Main St
- 411 E Chestnut St
- 502 E Walnut St
- 500 E Walnut St
- 504 E Walnut St
- 506 E Walnut St
- 200 Rice St
- 416 E Walnut St
- 407 E Chestnut St
- 500 E Chestnut St
- 503 E Chestnut St
- 412 E Walnut St
- 404 E Chestnut St
- 600 E Walnut St
- 505 E Chestnut St
- 410 E Walnut St
- 502 E Chestnut St
- 408 E Walnut St
- 604& 606 E Walnut St
- 504 E Chestnut St
- 507 E Chestnut St
Your Personal Tour Guide
Ask me questions while you tour the home.