417 Farley Rd Unit 419 Wendell, MA 01379
Wendell NeighborhoodEstimated Value: $163,000 - $348,000
2
Beds
1
Bath
910
Sq Ft
$286/Sq Ft
Est. Value
About This Home
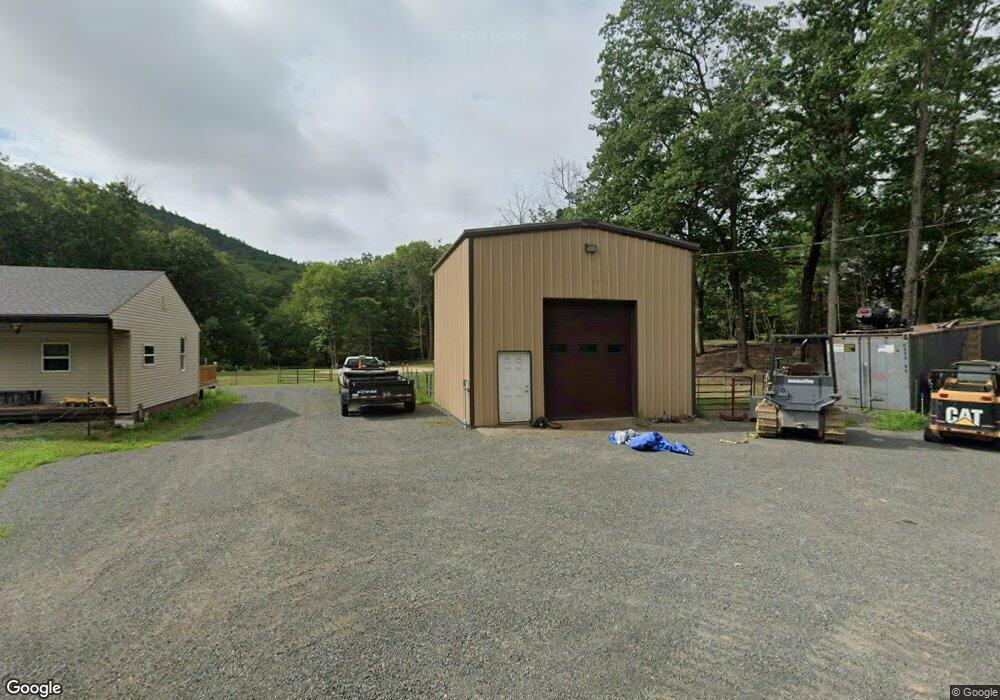
This home is located at 417 Farley Rd Unit 419, Wendell, MA 01379 and is currently estimated at $260,668, approximately $286 per square foot. 417 Farley Rd Unit 419 is a home located in Franklin County with nearby schools including Swift River School, Ralph C Mahar Regional School, and Kemsley Academy.
Ownership History
Date
Name
Owned For
Owner Type
Purchase Details
Closed on
Jan 31, 2019
Sold by
Finn Douglas C and Finn Elizabeth S
Bought by
Munson Mathew
Current Estimated Value
Home Financials for this Owner
Home Financials are based on the most recent Mortgage that was taken out on this home.
Original Mortgage
$62,000
Outstanding Balance
$54,509
Interest Rate
4.5%
Mortgage Type
New Conventional
Estimated Equity
$206,159
Purchase Details
Closed on
Aug 24, 2007
Sold by
Renaissance Home Loan
Bought by
Finn Douglas C and Finn Elizabeth S
Purchase Details
Closed on
Jul 12, 2007
Sold by
Renaissance Hm Equity
Bought by
Hsbc Bank Usa
Purchase Details
Closed on
May 12, 2004
Sold by
Bourbeau Marcielle E
Bought by
Bourbeau Earl H
Home Financials for this Owner
Home Financials are based on the most recent Mortgage that was taken out on this home.
Original Mortgage
$101,000
Interest Rate
5.47%
Create a Home Valuation Report for This Property
The Home Valuation Report is an in-depth analysis detailing your home's value as well as a comparison with similar homes in the area
Home Values in the Area
Average Home Value in this Area
Purchase History
| Date | Buyer | Sale Price | Title Company |
|---|---|---|---|
| Munson Mathew | $87,000 | -- | |
| Finn Douglas C | $60,600 | -- | |
| Hsbc Bank Usa | $133,920 | -- | |
| Bourbeau Earl H | -- | -- |
Source: Public Records
Mortgage History
| Date | Status | Borrower | Loan Amount |
|---|---|---|---|
| Open | Munson Mathew | $62,000 | |
| Previous Owner | Bourbeau Earl H | $136,000 | |
| Previous Owner | Bourbeau Earl H | $101,000 |
Source: Public Records
Tax History Compared to Growth
Tax History
| Year | Tax Paid | Tax Assessment Tax Assessment Total Assessment is a certain percentage of the fair market value that is determined by local assessors to be the total taxable value of land and additions on the property. | Land | Improvement |
|---|---|---|---|---|
| 2025 | $5,150 | $245,800 | $51,200 | $194,600 |
| 2024 | $3,535 | $159,600 | $51,200 | $108,400 |
| 2023 | $3,402 | $158,900 | $51,200 | $107,700 |
| 2022 | $3,479 | $149,700 | $49,500 | $100,200 |
| 2021 | $3,193 | $130,100 | $46,900 | $83,200 |
| 2020 | $1,739 | $72,900 | $46,900 | $26,000 |
| 2019 | $2,363 | $104,500 | $46,900 | $57,600 |
| 2018 | $2,630 | $125,500 | $46,900 | $78,600 |
| 2017 | $2,317 | $120,000 | $46,500 | $73,500 |
| 2016 | $2,326 | $120,000 | $46,500 | $73,500 |
| 2015 | $2,402 | $126,700 | $48,800 | $77,900 |
Source: Public Records
Map
Nearby Homes
- 0 Old Farley Rd
- 0 State Rd
- 10 W Main St
- 10 E Prospect St
- Lots 1-4 Kavanaugh Ln
- 529 S Mountain Rd
- 8 Craig Ave
- 104 S Mountain Rd
- 5 Bridge St
- 15 Crescent St
- 0 Meadow View Ln & Pine Meadow
- 28 Morse Village Rd
- 182 Main Rd
- 183 Millers Falls Rd
- 2 Alice St
- 202 Turnpike Rd
- 248 Holtshire Rd Unit Lot 2
- 21 Hillside Ave
- 45 Millers Falls Rd
- 0 Millers Falls Rd Unit 73034825