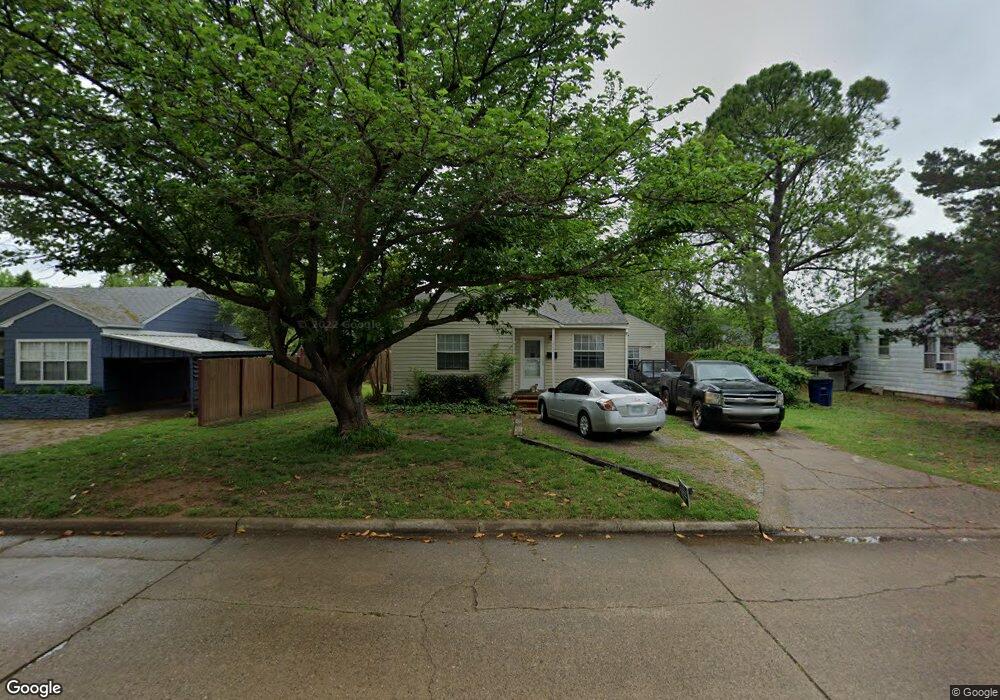
417 N 19th St Duncan, OK 73533
Estimated Value: $66,000 - $96,000
3
Beds
1
Bath
1,253
Sq Ft
$67/Sq Ft
Est. Value
About This Home
This home is located at 417 N 19th St, Duncan, OK 73533 and is currently estimated at $83,396, approximately $66 per square foot. 417 N 19th St is a home located in Stephens County with nearby schools including Horace Mann Elementary School, Duncan Middle School, and Duncan High School.
Ownership History
Date
Name
Owned For
Owner Type
Purchase Details
Closed on
Oct 25, 2016
Sold by
Skahill Anthony L
Bought by
Skahill Elizabeth G
Current Estimated Value
Purchase Details
Closed on
Feb 11, 2005
Sold by
Vaughn Greg
Bought by
Skahill Francis E
Home Financials for this Owner
Home Financials are based on the most recent Mortgage that was taken out on this home.
Original Mortgage
$36,063
Outstanding Balance
$18,328
Interest Rate
5.85%
Mortgage Type
Future Advance Clause Open End Mortgage
Estimated Equity
$65,068
Purchase Details
Closed on
Jun 12, 2001
Sold by
Thompson Jerry Don
Purchase Details
Closed on
Mar 29, 2001
Sold by
Thompson Joseph
Purchase Details
Closed on
Sep 8, 1994
Sold by
Thompson Joseph
Create a Home Valuation Report for This Property
The Home Valuation Report is an in-depth analysis detailing your home's value as well as a comparison with similar homes in the area
Home Values in the Area
Average Home Value in this Area
Purchase History
| Date | Buyer | Sale Price | Title Company |
|---|---|---|---|
| Skahill Elizabeth G | -- | None Available | |
| Skahill Francis E | $45,000 | None Available | |
| -- | $24,000 | -- | |
| -- | -- | -- | |
| -- | -- | -- |
Source: Public Records
Mortgage History
| Date | Status | Borrower | Loan Amount |
|---|---|---|---|
| Open | Skahill Francis E | $36,063 |
Source: Public Records
Tax History Compared to Growth
Tax History
| Year | Tax Paid | Tax Assessment Tax Assessment Total Assessment is a certain percentage of the fair market value that is determined by local assessors to be the total taxable value of land and additions on the property. | Land | Improvement |
|---|---|---|---|---|
| 2025 | $413 | $5,094 | $825 | $4,269 |
| 2024 | $413 | $4,852 | $825 | $4,027 |
| 2023 | $413 | $4,852 | $825 | $4,027 |
| 2022 | $374 | $4,401 | $825 | $3,576 |
| 2021 | $506 | $5,950 | $825 | $5,125 |
| 2020 | $466 | $5,397 | $825 | $4,572 |
| 2019 | $483 | $5,583 | $825 | $4,758 |
| 2018 | $497 | $5,583 | $825 | $4,758 |
| 2017 | $512 | $5,961 | $825 | $5,136 |
| 2016 | $547 | $6,432 | $825 | $5,607 |
| 2015 | $503 | $6,126 | $825 | $5,301 |
| 2014 | $503 | $5,834 | $825 | $5,009 |
Source: Public Records
Map
Nearby Homes
- 174831 N 2844 Rd
- 2011 2011 W Oak Ave
- 2006 W Oak Ave
- 210 N 22nd St
- 2108 Ave
- 209 N 22nd St
- 1812 W Walnut Ave
- 2210 Western Dr
- 1099 N 19th St
- 1309 W Beech Ave
- 201 N 23rd St
- 507 N Alice Dr
- 812 N 15th St
- 2206 2206 W Spruce
- 815 N 14th St
- 2204 W Parkview Ave
- 2110 W Main St
- 1807 W Chisholm Dr
- 2230 W Spruce St
- 27 N 14th St
- 415 N 19th St
- 419 N 19th St
- 420 Lester Blvd
- 418 Lester Blvd
- 422 Lester Blvd
- 421 N 19th St
- 413 N 19th St
- 413 N 19th St
- 168523 N 2800 Rd
- 279657 E 1690 Rd
- 169328 N 2790 Rd
- 168765 N 2800 Rd
- 278692 E 1690 Rd
- 169328 N 2790 Rd
- 168859 N 2800 Rd
- 168765 N 2800 Rd
- 179884 N 2910 Rd
- 418 N 19th St
- 420 N 19th St
- 416 Lester Blvd