Estimated Value: $585,000 - $643,803
4
Beds
2
Baths
1,892
Sq Ft
$330/Sq Ft
Est. Value
About This Home
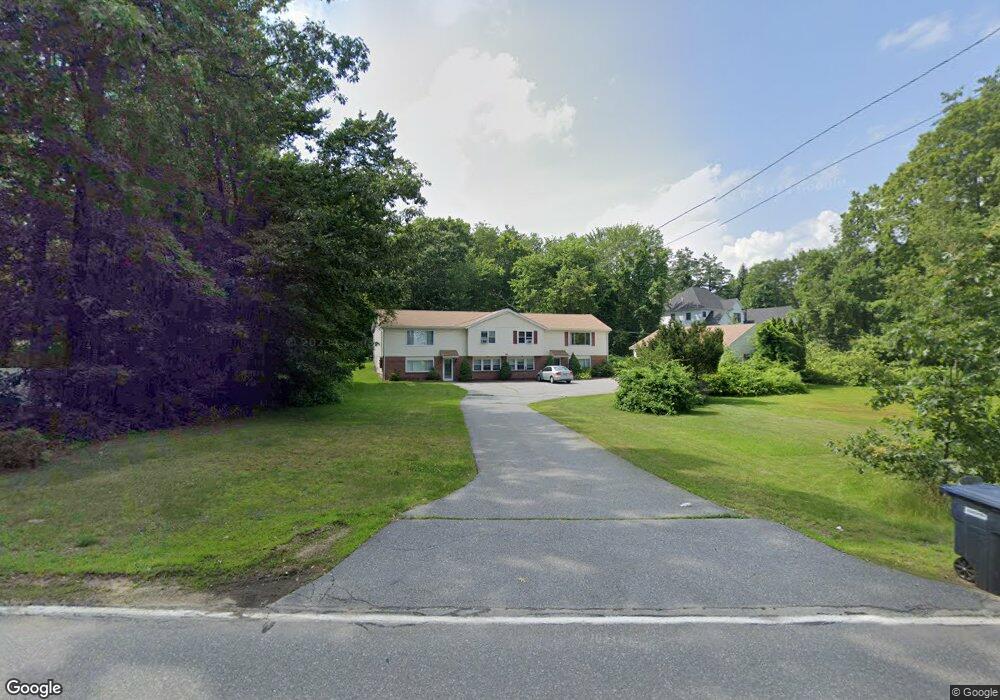
This home is located at 417 N Main St, Salem, NH 03079 and is currently estimated at $623,701, approximately $329 per square foot. 417 N Main St is a home located in Rockingham County with nearby schools including North Salem Elementary School, Woodbury School, and Salem High School.
Ownership History
Date
Name
Owned For
Owner Type
Purchase Details
Closed on
Apr 21, 2021
Sold by
Sarnie Lisa M
Bought by
Hood Sarah
Current Estimated Value
Home Financials for this Owner
Home Financials are based on the most recent Mortgage that was taken out on this home.
Original Mortgage
$458,541
Outstanding Balance
$414,338
Interest Rate
3.05%
Mortgage Type
FHA
Estimated Equity
$209,363
Purchase Details
Closed on
Apr 2, 2002
Sold by
Dube Richard and Dube Sally J
Bought by
Sarnie Lisa M
Home Financials for this Owner
Home Financials are based on the most recent Mortgage that was taken out on this home.
Original Mortgage
$263,900
Interest Rate
6.88%
Create a Home Valuation Report for This Property
The Home Valuation Report is an in-depth analysis detailing your home's value as well as a comparison with similar homes in the area
Purchase History
| Date | Buyer | Sale Price | Title Company |
|---|---|---|---|
| Hood Sarah | $467,000 | None Available | |
| Sarnie Lisa M | $329,900 | -- |
Source: Public Records
Mortgage History
| Date | Status | Borrower | Loan Amount |
|---|---|---|---|
| Open | Hood Sarah | $458,541 | |
| Previous Owner | Sarnie Lisa M | $230,300 | |
| Previous Owner | Sarnie Lisa M | $263,900 |
Source: Public Records
Tax History
| Year | Tax Paid | Tax Assessment Tax Assessment Total Assessment is a certain percentage of the fair market value that is determined by local assessors to be the total taxable value of land and additions on the property. | Land | Improvement |
|---|---|---|---|---|
| 2024 | $8,647 | $491,300 | $178,200 | $313,100 |
| 2023 | $8,332 | $491,300 | $178,200 | $313,100 |
| 2022 | $7,885 | $491,300 | $178,200 | $313,100 |
| 2021 | $7,851 | $491,300 | $178,200 | $313,100 |
| 2020 | $8,013 | $363,900 | $127,400 | $236,500 |
| 2019 | $7,999 | $363,900 | $127,400 | $236,500 |
| 2018 | $7,659 | $363,900 | $127,400 | $236,500 |
| 2017 | $7,434 | $363,900 | $127,400 | $236,500 |
| 2016 | $7,434 | $363,900 | $127,400 | $236,500 |
| 2015 | $6,864 | $320,900 | $124,500 | $196,400 |
| 2014 | $6,672 | $320,900 | $124,500 | $196,400 |
| 2013 | $6,566 | $320,900 | $124,500 | $196,400 |
Source: Public Records
Map
Nearby Homes
- 398 N Main St
- 15 King St
- 60 Shore Dr
- 69 Caddy Dr
- 71 Caddy Dr
- 65 Caddy Dr
- 84 Caddy Dr
- 85 Caddy Dr
- 16 Fox Run Ln Unit 10382
- 16 Fox Run Ln
- 182 Shore Dr
- 114 Chases Grove Rd
- 105 Conleys Grove Rd
- 11 Bartlett Rd
- 120 Chases Grove Rd
- 64 Trails Edge Rd
- 343 Island Pond Rd
- 55 Trails Edge Rd
- 35 Steele Rd
- 53 Trails Edge Rd
Your Personal Tour Guide
Ask me questions while you tour the home.