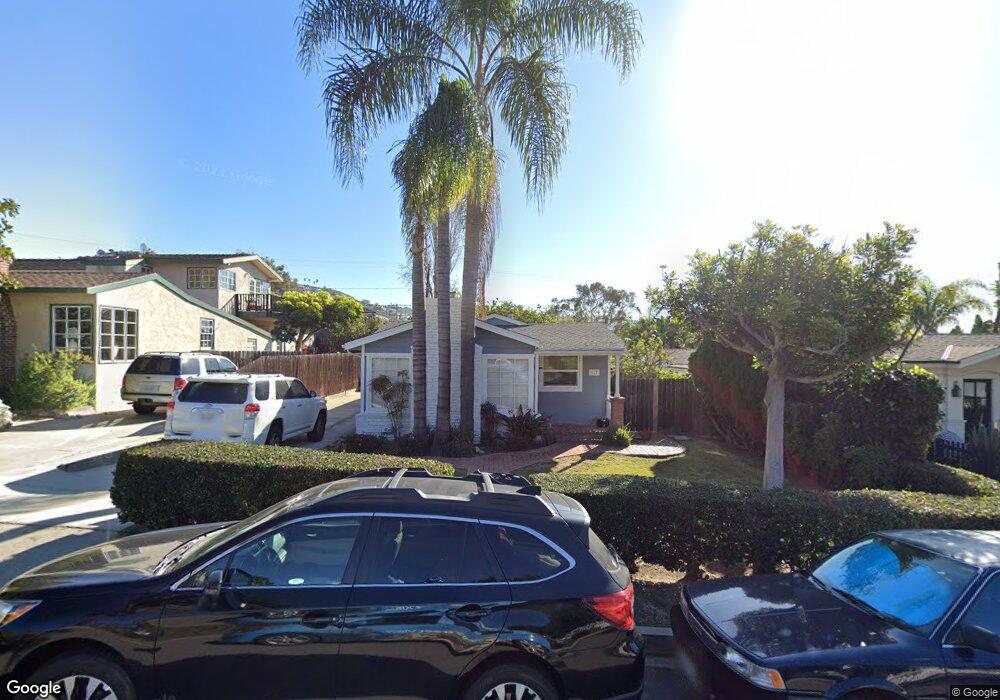
417 Poplar St Laguna Beach, CA 92651
North Laguna NeighborhoodEstimated Value: $2,779,000 - $2,900,000
3
Beds
3
Baths
2,066
Sq Ft
$1,381/Sq Ft
Est. Value
About This Home
This home is located at 417 Poplar St, Laguna Beach, CA 92651 and is currently estimated at $2,852,285, approximately $1,380 per square foot. 417 Poplar St is a home located in Orange County with nearby schools including El Morro Elementary School, Thurston Middle School, and Laguna Beach High School.
Ownership History
Date
Name
Owned For
Owner Type
Purchase Details
Closed on
Aug 7, 2002
Sold by
Austin Paul M and Austin Nancy M
Bought by
Austin Paul M and Austin Nancy M
Current Estimated Value
Purchase Details
Closed on
Oct 22, 1997
Sold by
Ingham Michael G and Ingham Fenton B
Bought by
Austin Paul M and Austin Nancy
Home Financials for this Owner
Home Financials are based on the most recent Mortgage that was taken out on this home.
Original Mortgage
$272,000
Interest Rate
7.19%
Mortgage Type
Purchase Money Mortgage
Purchase Details
Closed on
Mar 16, 1993
Sold by
Ingham Michael G and Ingham Fenton B
Bought by
Ingham Michael G and Ingham Fenton B
Home Financials for this Owner
Home Financials are based on the most recent Mortgage that was taken out on this home.
Original Mortgage
$226,000
Interest Rate
7.74%
Mortgage Type
Purchase Money Mortgage
Create a Home Valuation Report for This Property
The Home Valuation Report is an in-depth analysis detailing your home's value as well as a comparison with similar homes in the area
Home Values in the Area
Average Home Value in this Area
Purchase History
| Date | Buyer | Sale Price | Title Company |
|---|---|---|---|
| Austin Paul M | -- | -- | |
| Austin Paul M | -- | -- | |
| Austin Paul M | $257,500 | First Southwestern Title Co | |
| Ingham Michael G | -- | Southland Title Corporation |
Source: Public Records
Mortgage History
| Date | Status | Borrower | Loan Amount |
|---|---|---|---|
| Previous Owner | Austin Paul M | $272,000 | |
| Previous Owner | Ingham Michael G | $226,000 |
Source: Public Records
Tax History Compared to Growth
Tax History
| Year | Tax Paid | Tax Assessment Tax Assessment Total Assessment is a certain percentage of the fair market value that is determined by local assessors to be the total taxable value of land and additions on the property. | Land | Improvement |
|---|---|---|---|---|
| 2025 | $7,719 | $537,297 | $456,714 | $80,583 |
| 2024 | $7,719 | $526,762 | $447,759 | $79,003 |
| 2023 | $8,143 | $516,434 | $438,980 | $77,454 |
| 2022 | $7,852 | $506,308 | $430,372 | $75,936 |
| 2021 | $7,568 | $496,381 | $421,933 | $74,448 |
| 2020 | $7,341 | $491,292 | $417,607 | $73,685 |
| 2019 | $7,155 | $481,659 | $409,418 | $72,241 |
| 2018 | $6,980 | $472,215 | $401,390 | $70,825 |
| 2017 | $6,796 | $462,956 | $393,519 | $69,437 |
| 2016 | $6,621 | $453,879 | $385,803 | $68,076 |
| 2015 | $6,473 | $447,062 | $380,008 | $67,054 |
| 2014 | $6,320 | $438,305 | $372,564 | $65,741 |
Source: Public Records
Map
Nearby Homes
- 425 Poplar St
- 411 Poplar St Unit 1
- 411 Poplar St
- 433 Poplar St
- 230 Monterey Dr
- 401 Poplar St
- 420 Linden St
- 430 Linden St Unit back
- 430 Linden St
- 410 Linden St
- 441 Poplar St
- 412 Poplar St
- 440 Linden St
- 406 Linden St
- 265 Monterey Dr
- 420 Poplar St
- 400 Poplar St
- 428 Poplar St
- 397 Poplar St
- 229 Monterey Dr Unit upper