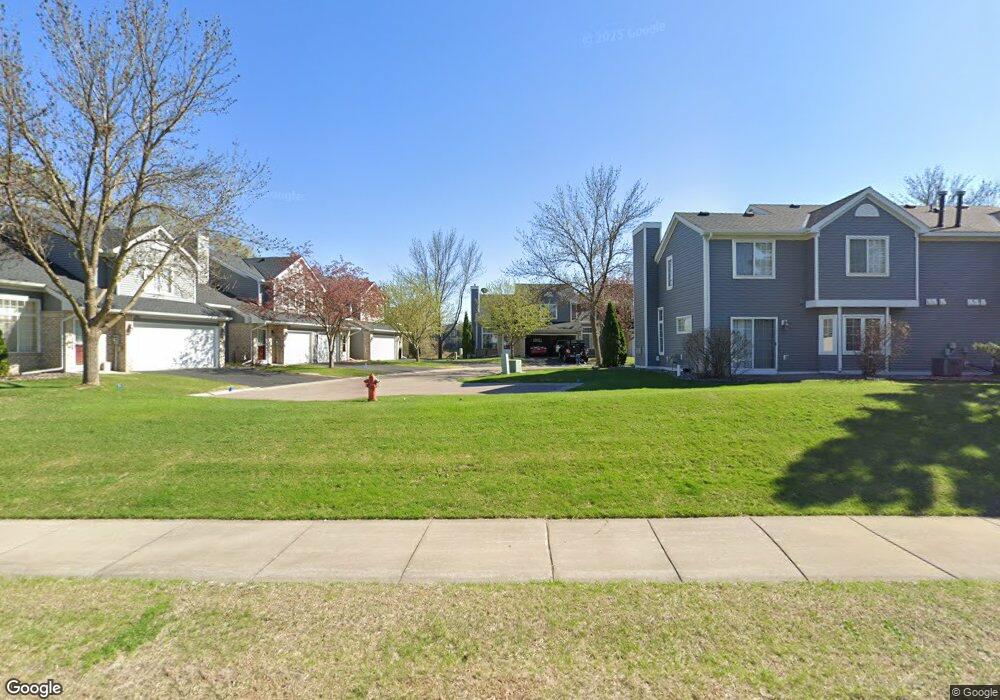
417 Rice Ct Chanhassen, MN 55317
Estimated Value: $296,000 - $319,323
2
Beds
2
Baths
1,440
Sq Ft
$214/Sq Ft
Est. Value
About This Home
This home is located at 417 Rice Ct, Chanhassen, MN 55317 and is currently estimated at $308,331, approximately $214 per square foot. 417 Rice Ct is a home located in Carver County with nearby schools including Chanhassen Elementary School, Pioneer Ridge Middle School, and Chanhassen High School.
Ownership History
Date
Name
Owned For
Owner Type
Purchase Details
Closed on
Mar 29, 2019
Sold by
Le Jennifer Cam
Bought by
Pham Hoang Minh
Current Estimated Value
Home Financials for this Owner
Home Financials are based on the most recent Mortgage that was taken out on this home.
Original Mortgage
$172,000
Outstanding Balance
$151,219
Interest Rate
4.3%
Mortgage Type
New Conventional
Estimated Equity
$157,112
Purchase Details
Closed on
Jul 30, 2009
Sold by
Kunze Kevin and Kunze Elizabeth
Bought by
Pham Hoang Minh
Home Financials for this Owner
Home Financials are based on the most recent Mortgage that was taken out on this home.
Original Mortgage
$157,509
Interest Rate
5.36%
Mortgage Type
FHA
Purchase Details
Closed on
Oct 22, 2004
Sold by
Casmer Christine and Krawczak David A
Bought by
Kunze Kevin
Purchase Details
Closed on
Jun 15, 2001
Sold by
Peck Troy E and Peck Jennifer L
Bought by
Krawczak David A and Casmer Christine
Purchase Details
Closed on
Jun 20, 1996
Sold by
The Rottlund Co
Bought by
Peck Troy E and Peck Jennifer L
Create a Home Valuation Report for This Property
The Home Valuation Report is an in-depth analysis detailing your home's value as well as a comparison with similar homes in the area
Home Values in the Area
Average Home Value in this Area
Purchase History
| Date | Buyer | Sale Price | Title Company |
|---|---|---|---|
| Pham Hoang Minh | $500 | Cambria Title | |
| Pham Hoang Minh | $172,000 | -- | |
| Kunze Kevin | $195,000 | -- | |
| Krawczak David A | $160,000 | -- | |
| Peck Troy E | $113,900 | -- |
Source: Public Records
Mortgage History
| Date | Status | Borrower | Loan Amount |
|---|---|---|---|
| Open | Pham Hoang Minh | $172,000 | |
| Previous Owner | Pham Hoang Minh | $157,509 |
Source: Public Records
Tax History Compared to Growth
Tax History
| Year | Tax Paid | Tax Assessment Tax Assessment Total Assessment is a certain percentage of the fair market value that is determined by local assessors to be the total taxable value of land and additions on the property. | Land | Improvement |
|---|---|---|---|---|
| 2025 | $2,744 | $303,000 | $75,000 | $228,000 |
| 2024 | $2,678 | $280,700 | $70,000 | $210,700 |
| 2023 | $2,642 | $269,500 | $70,000 | $199,500 |
| 2022 | $2,526 | $268,200 | $68,700 | $199,500 |
| 2021 | $2,294 | $215,000 | $57,200 | $157,800 |
| 2020 | $2,252 | $206,800 | $57,200 | $149,600 |
| 2019 | $2,238 | $197,600 | $54,500 | $143,100 |
| 2018 | $2,024 | $197,600 | $54,500 | $143,100 |
| 2017 | $2,098 | $176,900 | $49,600 | $127,300 |
| 2016 | $2,106 | $148,900 | $0 | $0 |
| 2015 | $1,926 | $143,300 | $0 | $0 |
| 2014 | $1,926 | $126,900 | $0 | $0 |
Source: Public Records
Map
Nearby Homes
- 420 Monk Ct
- 513 Mission Hills Way W
- 537 Mission Hills Dr
- 179 Lakeview Rd E
- 732 Wildflower Ln
- 763 Stonegate Rd
- 8627 Lake Riley Dr
- 441 Lyman Blvd
- 8933 SW Village Loop
- 742 Maggie Way
- 600 Lyman Blvd
- 8973 SW Village Loop
- 25 Riley Ridge
- TBD County Road 101
- 9235 Lake Riley Blvd
- 18844 Bearpath Trail
- 18709 Melrose Chase
- 9002 Riley Lake Rd
- 9399 Eagle Ridge Rd
- 9550 Foxford Rd
- 421 Rice Ct Unit 133
- 429 Rice Ct Unit 131
- 425 Rice Ct
- 413 Rice Ct
- 409 Rice Ct Unit 136
- 418 Rice Ct
- 405 Rice Ct Unit 137
- 422 Rice Ct
- 401 Rice Ct Unit 138
- 428 Monk Ct
- 442 Mission Hills Way E
- 438 Mission Hills Way E
- 434 Mission Hills Way E
- 446 Mission Hills Way E
- 424 Monk Ct
- 450 Mission Hills Way E Unit 128
- 416 Monk Ct Unit 110
- 425 Monk Ct
- 412 Monk Ct
- 8581 Mission Hills Ln