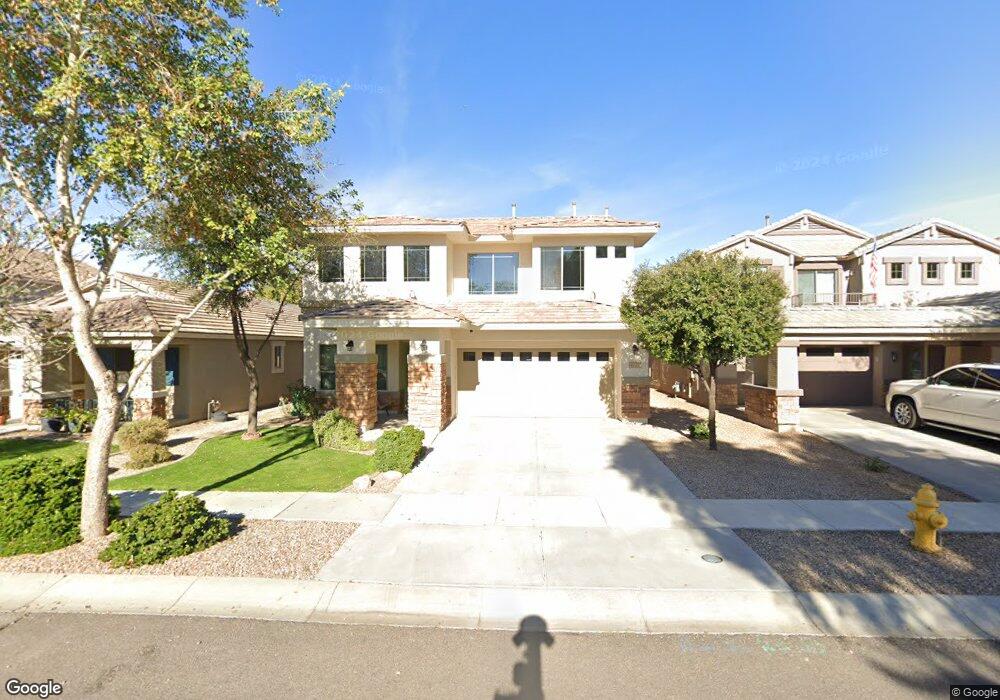
4170 E Sandy Way Gilbert, AZ 85297
Power Ranch NeighborhoodEstimated Value: $565,000 - $588,000
4
Beds
3
Baths
2,301
Sq Ft
$251/Sq Ft
Est. Value
About This Home
This home is located at 4170 E Sandy Way, Gilbert, AZ 85297 and is currently estimated at $578,043, approximately $251 per square foot. 4170 E Sandy Way is a home located in Maricopa County with nearby schools including Centennial Elementary School, Sossaman Middle School, and Higley High School.
Ownership History
Date
Name
Owned For
Owner Type
Purchase Details
Closed on
Jun 24, 2024
Sold by
May Anthony and May Jennifer Kaye
Bought by
Anthony L May And Jennifer K May Trust and May
Current Estimated Value
Purchase Details
Closed on
May 6, 2012
Sold by
May Anthony
Bought by
May Anthony and May Jennifer Kaye
Home Financials for this Owner
Home Financials are based on the most recent Mortgage that was taken out on this home.
Original Mortgage
$212,500
Interest Rate
3.9%
Mortgage Type
VA
Purchase Details
Closed on
Apr 30, 2012
Sold by
May Jennifer
Bought by
May Anthony L
Home Financials for this Owner
Home Financials are based on the most recent Mortgage that was taken out on this home.
Original Mortgage
$212,500
Interest Rate
3.9%
Mortgage Type
VA
Purchase Details
Closed on
Apr 27, 2012
Sold by
D R Horton Inc
Bought by
May Anthony
Home Financials for this Owner
Home Financials are based on the most recent Mortgage that was taken out on this home.
Original Mortgage
$212,500
Interest Rate
3.9%
Mortgage Type
VA
Create a Home Valuation Report for This Property
The Home Valuation Report is an in-depth analysis detailing your home's value as well as a comparison with similar homes in the area
Home Values in the Area
Average Home Value in this Area
Purchase History
| Date | Buyer | Sale Price | Title Company |
|---|---|---|---|
| Anthony L May And Jennifer K May Trust | -- | None Listed On Document | |
| May Anthony | -- | None Available | |
| May Anthony L | -- | Dhi Title Agency | |
| May Anthony | $212,500 | Dhi Title Agency |
Source: Public Records
Mortgage History
| Date | Status | Borrower | Loan Amount |
|---|---|---|---|
| Previous Owner | May Anthony L | $212,500 |
Source: Public Records
Tax History
| Year | Tax Paid | Tax Assessment Tax Assessment Total Assessment is a certain percentage of the fair market value that is determined by local assessors to be the total taxable value of land and additions on the property. | Land | Improvement |
|---|---|---|---|---|
| 2025 | $2,183 | $29,481 | -- | -- |
| 2024 | $2,340 | $28,077 | -- | -- |
| 2023 | $2,340 | $44,220 | $8,840 | $35,380 |
| 2022 | $2,237 | $31,620 | $6,320 | $25,300 |
| 2021 | $2,304 | $29,970 | $5,990 | $23,980 |
| 2020 | $2,349 | $27,380 | $5,470 | $21,910 |
| 2019 | $2,274 | $24,730 | $4,940 | $19,790 |
| 2018 | $2,194 | $23,710 | $4,740 | $18,970 |
| 2017 | $2,115 | $23,160 | $4,630 | $18,530 |
| 2016 | $2,112 | $22,350 | $4,470 | $17,880 |
| 2015 | $1,877 | $21,620 | $4,320 | $17,300 |
Source: Public Records
Map
Nearby Homes
- 4182 E Bonanza Rd
- 3800 E Woodside Way
- 3759 S Dew Drop Ln
- 3488 S Seneca Way
- 4186 E Blue Sage Rd
- 4140 E Claxton Ave
- 3891 E Melrose St
- 3725 E Woodside Way
- 3724 E Derringer Way
- 4597 E Waterman St
- 3836 S Coach House Dr
- 4230 E Ronald St
- 3684 E Remington Dr
- 3853 E Claxton Ave
- 3500 S Arroyo Ln
- 3844 E Battala Ave
- 3669 E Derringer Way
- 4352 E Santa fe Ct
- 3816 E Phelps St
- 0 S 172nd Way
- 4174 E Sandy Way
- 4168 E Sandy Way
- 4178 E Sandy Way
- 4164 E Sandy Way
- 4195 E Bonanza Rd
- 4199 E Bonanza Rd
- 4191 E Bonanza Rd
- 4184 E Sandy Way
- 4158 E Sandy Way
- 4185 E Bonanza Rd
- 4205 E Bonanza Rd
- 4163 E Sandy Way
- 4167 E Sandy Way
- 4171 E Sandy Way
- 4209 E Bonanza Rd
- 4181 E Bonanza Rd
- 4159 E Sandy Way
- 4188 E Sandy Way
- 4154 E Sandy Way
- 4175 E Sandy Way
Your Personal Tour Guide
Ask me questions while you tour the home.