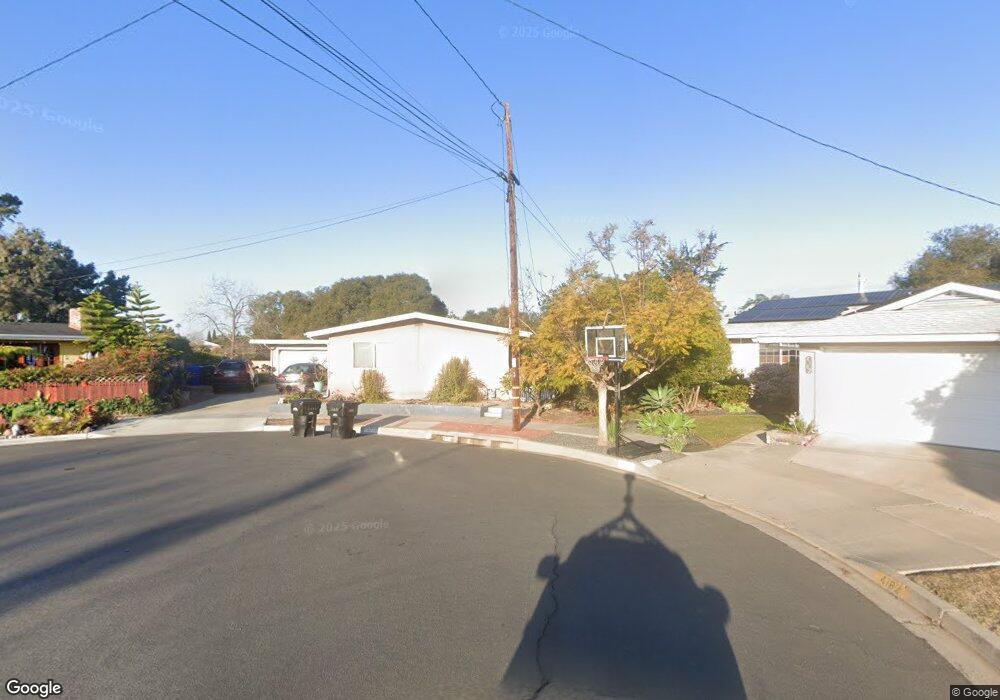
4170 Pamela Ct San Diego, CA 92117
North Clairemont NeighborhoodEstimated Value: $1,093,000 - $1,136,736
3
Beds
2
Baths
1,100
Sq Ft
$1,012/Sq Ft
Est. Value
About This Home
This home is located at 4170 Pamela Ct, San Diego, CA 92117 and is currently estimated at $1,113,184, approximately $1,011 per square foot. 4170 Pamela Ct is a home located in San Diego County with nearby schools including Field Elementary School, Innovation Middle School, and Madison High School.
Ownership History
Date
Name
Owned For
Owner Type
Purchase Details
Closed on
Jan 4, 2002
Sold by
Cagle James Doyle and Cagle Pauline
Bought by
Mcgee Patrick Sean and Fulbright Mcgee Annette M
Current Estimated Value
Home Financials for this Owner
Home Financials are based on the most recent Mortgage that was taken out on this home.
Original Mortgage
$200,000
Outstanding Balance
$82,252
Interest Rate
7.13%
Estimated Equity
$1,030,932
Create a Home Valuation Report for This Property
The Home Valuation Report is an in-depth analysis detailing your home's value as well as a comparison with similar homes in the area
Home Values in the Area
Average Home Value in this Area
Purchase History
| Date | Buyer | Sale Price | Title Company |
|---|---|---|---|
| Mcgee Patrick Sean | $336,000 | Chicago Title Co |
Source: Public Records
Mortgage History
| Date | Status | Borrower | Loan Amount |
|---|---|---|---|
| Open | Mcgee Patrick Sean | $200,000 |
Source: Public Records
Tax History
| Year | Tax Paid | Tax Assessment Tax Assessment Total Assessment is a certain percentage of the fair market value that is determined by local assessors to be the total taxable value of land and additions on the property. | Land | Improvement |
|---|---|---|---|---|
| 2025 | $6,233 | $521,938 | $319,082 | $202,856 |
| 2024 | $6,233 | $511,705 | $312,826 | $198,879 |
| 2023 | $6,094 | $501,673 | $306,693 | $194,980 |
| 2022 | $5,930 | $491,837 | $300,680 | $191,157 |
| 2021 | $5,888 | $482,194 | $294,785 | $187,409 |
| 2020 | $5,816 | $477,251 | $291,763 | $185,488 |
| 2019 | $5,711 | $467,894 | $286,043 | $181,851 |
| 2018 | $5,338 | $458,721 | $280,435 | $178,286 |
| 2017 | $81 | $449,728 | $274,937 | $174,791 |
| 2016 | $5,125 | $440,911 | $269,547 | $171,364 |
| 2015 | $5,048 | $434,289 | $265,499 | $168,790 |
| 2014 | $4,968 | $425,783 | $260,299 | $165,484 |
Source: Public Records
Map
Nearby Homes
- 4380 Rolfe Rd
- 4203 Tolowa St
- 4161 Clairemont Mesa Blvd
- 4410 Gila Ave
- 4413 Mount Henry Ave
- 4646 Coconino Way
- 3910 Hiawatha Way
- 3582 Hatteras Ave
- 3861 Hiawatha Way
- 4327-29 Clairemont Mesa Blvd
- 4774 Chickasaw Ct
- 4595 Chateau Dr
- 4534 Chateau Dr
- 4924 4930 Iroquois Ave
- 4885 Cole St Unit 36
- 4597 Acoma Ave
- 4550 Diane Way
- 4951 57 Genesee Ave
- 3346-48 Luna Ave
- 5002 Dubois Dr
- 4181 Pamela Ct
- 4182 Pamela Ct
- 4496 Rolfe Rd
- 4502 Rolfe Rd
- 4473 Bertha Ct
- 4512 Rolfe Rd
- 4488 Rolfe Rd
- 4522 Rolfe Rd
- 4545 Quantico Ave
- 4480 Rolfe Rd
- 4532 Rolfe Rd
- 4474 Bertha Ct
- 4535 Quantico Ave
- 4525 Quantico Ave
- 4542 Rolfe Rd
- 4472 Rolfe Rd
- 4515 Quantico Ave
- 4463 Bertha Ct
- 4555 Quantico Ave
- 4464 Bertha Ct
Your Personal Tour Guide
Ask me questions while you tour the home.