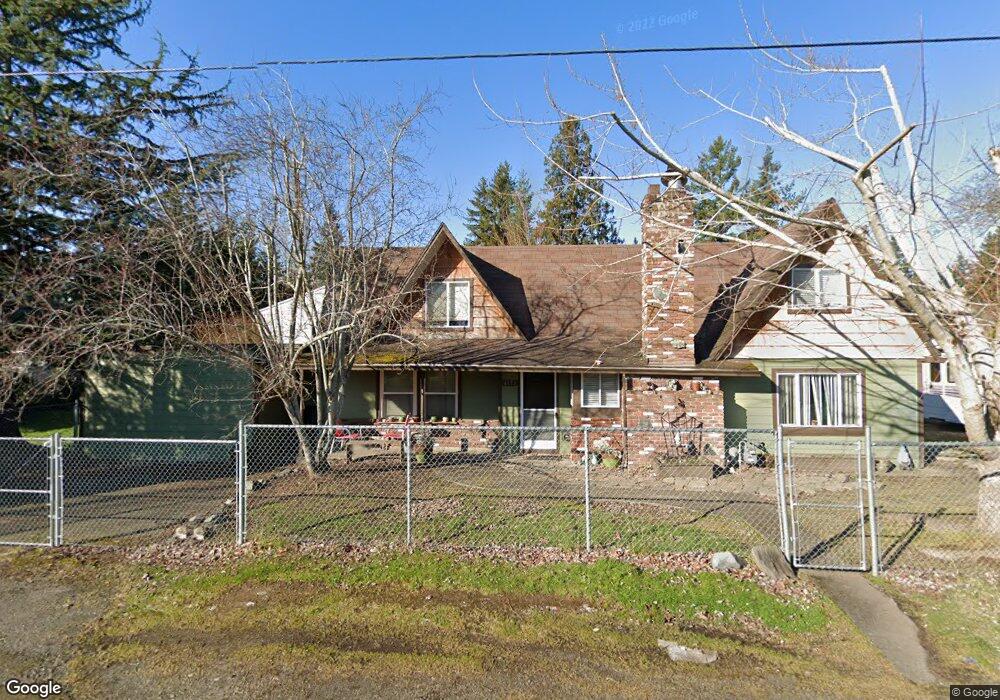
4171 NE 8th St Gresham, OR 97030
Powell Valley NeighborhoodEstimated Value: $407,000 - $493,000
4
Beds
2
Baths
2,201
Sq Ft
$207/Sq Ft
Est. Value
About This Home
This home is located at 4171 NE 8th St, Gresham, OR 97030 and is currently estimated at $455,399, approximately $206 per square foot. 4171 NE 8th St is a home located in Multnomah County with nearby schools including Powell Valley Elementary School, Gordon Russell Middle School, and Sam Barlow High School.
Ownership History
Date
Name
Owned For
Owner Type
Purchase Details
Closed on
Jun 13, 2007
Sold by
Warren Joleen K
Bought by
Warren Tyler and Warren Joleen
Current Estimated Value
Home Financials for this Owner
Home Financials are based on the most recent Mortgage that was taken out on this home.
Original Mortgage
$150,000
Outstanding Balance
$91,535
Interest Rate
6.14%
Mortgage Type
New Conventional
Estimated Equity
$363,864
Purchase Details
Closed on
May 30, 2006
Sold by
Urbanski Edward J and Urbanski Barbara O
Bought by
Warren Joleen K
Home Financials for this Owner
Home Financials are based on the most recent Mortgage that was taken out on this home.
Original Mortgage
$130,000
Interest Rate
6.52%
Mortgage Type
Fannie Mae Freddie Mac
Purchase Details
Closed on
Jan 15, 2002
Sold by
Urbanski Edward J and Urbanski Barbara O
Bought by
Urbanski Edward J and Urbanski Barbara D
Home Financials for this Owner
Home Financials are based on the most recent Mortgage that was taken out on this home.
Original Mortgage
$118,400
Interest Rate
6.84%
Create a Home Valuation Report for This Property
The Home Valuation Report is an in-depth analysis detailing your home's value as well as a comparison with similar homes in the area
Home Values in the Area
Average Home Value in this Area
Purchase History
| Date | Buyer | Sale Price | Title Company |
|---|---|---|---|
| Warren Tyler | -- | Accommodation | |
| Warren Joleen K | $206,000 | Fidelity Natl Title Co Of Or | |
| Urbanski Edward J | -- | -- |
Source: Public Records
Mortgage History
| Date | Status | Borrower | Loan Amount |
|---|---|---|---|
| Open | Warren Tyler | $150,000 | |
| Closed | Warren Joleen K | $130,000 | |
| Previous Owner | Urbanski Edward J | $118,400 |
Source: Public Records
Tax History
| Year | Tax Paid | Tax Assessment Tax Assessment Total Assessment is a certain percentage of the fair market value that is determined by local assessors to be the total taxable value of land and additions on the property. | Land | Improvement |
|---|---|---|---|---|
| 2025 | $4,870 | $239,310 | -- | -- |
| 2024 | $4,662 | $232,340 | -- | -- |
| 2023 | $4,662 | $225,580 | -- | -- |
| 2022 | $4,128 | $219,010 | $0 | $0 |
| 2021 | $4,025 | $212,640 | $0 | $0 |
| 2020 | $3,787 | $206,450 | $0 | $0 |
| 2019 | $3,688 | $200,440 | $0 | $0 |
| 2018 | $3,516 | $194,610 | $0 | $0 |
| 2017 | $3,374 | $188,950 | $0 | $0 |
| 2016 | $2,974 | $183,450 | $0 | $0 |
| 2015 | $2,910 | $178,110 | $0 | $0 |
| 2014 | $2,839 | $172,930 | $0 | $0 |
Source: Public Records
Map
Nearby Homes
- 4117 NE 8th St Unit 9
- 499 NE Williams Rd
- 4055 NE 13th Terrace
- 4111 NE 3rd St
- 2505 SE Troutdale Rd
- 3877 NE 3rd St
- 150 NE Greenway Dr
- 4343 NE 1st St
- 275 NE Scott Dr
- 64 NE Scott Dr
- 180 NE Kane Dr Unit 180
- 845 SE 48th St
- 3545 SE 1st St
- 1480 NE Kane Dr
- 4396 SE 1st Terrace
- 1465 NE Kane Dr Unit 4
- 2980 NE Division St Unit 31
- 2980 NE Division St Unit 13
- 2980 NE Division St Unit 43
- 4545 SE 3rd St
- 4100 NE Division St Unit 4106
- 4224 NE 8th St Unit 4228
- 4174 NE 8th St Unit 4184
- 4256 NE 8th St Unit 4258
- 672 NE Wendy Ln
- 780 NE Wendy Ln
- 4120 NE 8th St Unit 4140
- 4280 NE Division St Unit 4290
- 4120-4140 NE 8th St
- 656 NE Wendy Ln
- 698 NE Wendy Ln
- 4125 NE 8th St Unit 13
- 4127 NE 8th St Unit 14
- 4123 NE 8th St
- 4101 NE 8th St Unit 1
- 4103 NE 8th St Unit 2
- 4121 NE 8th St
- 4105 NE 8th St
- 752 NE Wendy Ln
- 4111 NE 8th St Unit 6
Your Personal Tour Guide
Ask me questions while you tour the home.