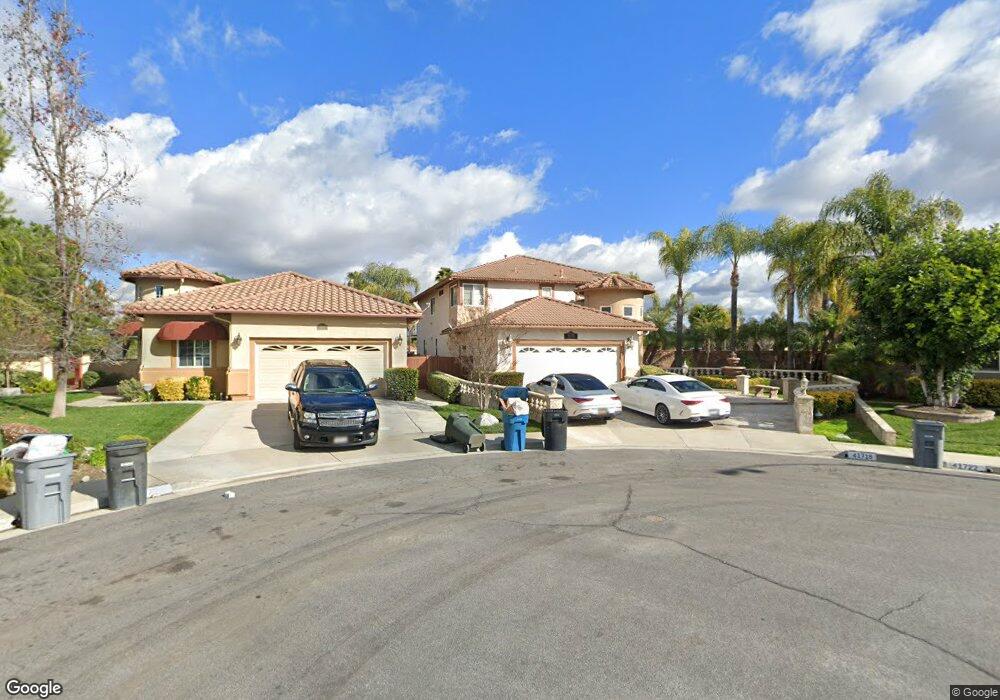
41718 Niblick Rd Temecula, CA 92591
Margarita Village-Temeku Hills NeighborhoodEstimated Value: $754,000 - $795,000
4
Beds
3
Baths
2,489
Sq Ft
$312/Sq Ft
Est. Value
About This Home
This home is located at 41718 Niblick Rd, Temecula, CA 92591 and is currently estimated at $775,968, approximately $311 per square foot. 41718 Niblick Rd is a home located in Riverside County with nearby schools including Vintage Hills Elementary School, Margarita Middle School, and Temecula Valley High School.
Ownership History
Date
Name
Owned For
Owner Type
Purchase Details
Closed on
Jan 31, 2024
Sold by
Kirtides Dominique A
Bought by
Kirtides Family Trust and Kirtides
Current Estimated Value
Purchase Details
Closed on
Aug 26, 2010
Sold by
Kirtides Dominique A and Boussiacos Dominique A
Bought by
Kirtides Dominique A
Home Financials for this Owner
Home Financials are based on the most recent Mortgage that was taken out on this home.
Original Mortgage
$235,600
Interest Rate
4.51%
Mortgage Type
New Conventional
Purchase Details
Closed on
Oct 14, 1999
Sold by
M-A Temeku Hills Development Llc
Bought by
Boussiacos Dominique A
Home Financials for this Owner
Home Financials are based on the most recent Mortgage that was taken out on this home.
Original Mortgage
$202,490
Interest Rate
7.82%
Mortgage Type
Stand Alone First
Create a Home Valuation Report for This Property
The Home Valuation Report is an in-depth analysis detailing your home's value as well as a comparison with similar homes in the area
Home Values in the Area
Average Home Value in this Area
Purchase History
| Date | Buyer | Sale Price | Title Company |
|---|---|---|---|
| Kirtides Family Trust | -- | None Listed On Document | |
| Kirtides Dominique A | -- | Ticor Title Company Of Ca | |
| Boussiacos Dominique A | $270,000 | First American Title Co |
Source: Public Records
Mortgage History
| Date | Status | Borrower | Loan Amount |
|---|---|---|---|
| Previous Owner | Kirtides Dominique A | $235,600 | |
| Previous Owner | Boussiacos Dominique A | $202,490 |
Source: Public Records
Tax History
| Year | Tax Paid | Tax Assessment Tax Assessment Total Assessment is a certain percentage of the fair market value that is determined by local assessors to be the total taxable value of land and additions on the property. | Land | Improvement |
|---|---|---|---|---|
| 2025 | $5,567 | $467,529 | $99,887 | $367,642 |
| 2023 | $5,567 | $449,376 | $96,009 | $353,367 |
| 2022 | $5,396 | $440,566 | $94,127 | $346,439 |
| 2021 | $5,284 | $431,929 | $92,282 | $339,647 |
| 2020 | $5,226 | $427,501 | $91,336 | $336,165 |
| 2019 | $5,149 | $419,120 | $89,546 | $329,574 |
| 2018 | $5,049 | $410,903 | $87,791 | $323,112 |
| 2017 | $4,958 | $402,847 | $86,070 | $316,777 |
| 2016 | $4,863 | $394,949 | $84,383 | $310,566 |
| 2015 | $4,777 | $389,018 | $83,116 | $305,902 |
| 2014 | $4,635 | $381,399 | $81,489 | $299,910 |
Source: Public Records
Map
Nearby Homes
- 31130 S General Kearny Rd Unit 89
- 31130 S General Kearny Rd Unit 145
- 31130 S General Kearny Rd Unit 147
- 31130 S General Kearny Rd Unit 136
- 31130 S General Kearny Rd Unit 151
- 31130 S General Kearny Rd Unit 153
- 31130 S General Kearny Rd Unit 134
- 31130 S General Kearny Rd Unit 163
- 41451 Royal Dornoch Ct
- 41950 Delmonte St
- 31399 Paseo de Las Olas
- 31465 Inverness Ct
- 31423 Paseo de Las Olas
- 41309 Pine Tree Cir
- 30840 Point Woods Ct
- 30910 Crystalaire Dr
- 41606 Slice Way
- 30816 Point Woods Ct
- 30874 Crystalaire Dr
- 41552 Willow Run Rd
- 41722 Niblick Rd
- 41707 Niblick Rd
- 41728 Niblick Rd
- 31193 Nassau Ct
- 41713 Niblick Rd
- 41734 Niblick Rd
- 31185 Nassau Ct
- 41719 Niblick Rd
- 41725 Niblick Rd
- 41742 Niblick Rd
- 31177 Nassau Ct
- 31086 Spoon Cir
- 31078 Spoon Cir
- 31160 Nassau Ct
- 41750 Niblick Rd
- 31070 Spoon Cir
- 31169 Nassau Ct
- 41758 Niblick Rd
- 31144 Nassau Ct
- 31161 Nassau Ct
Your Personal Tour Guide
Ask me questions while you tour the home.