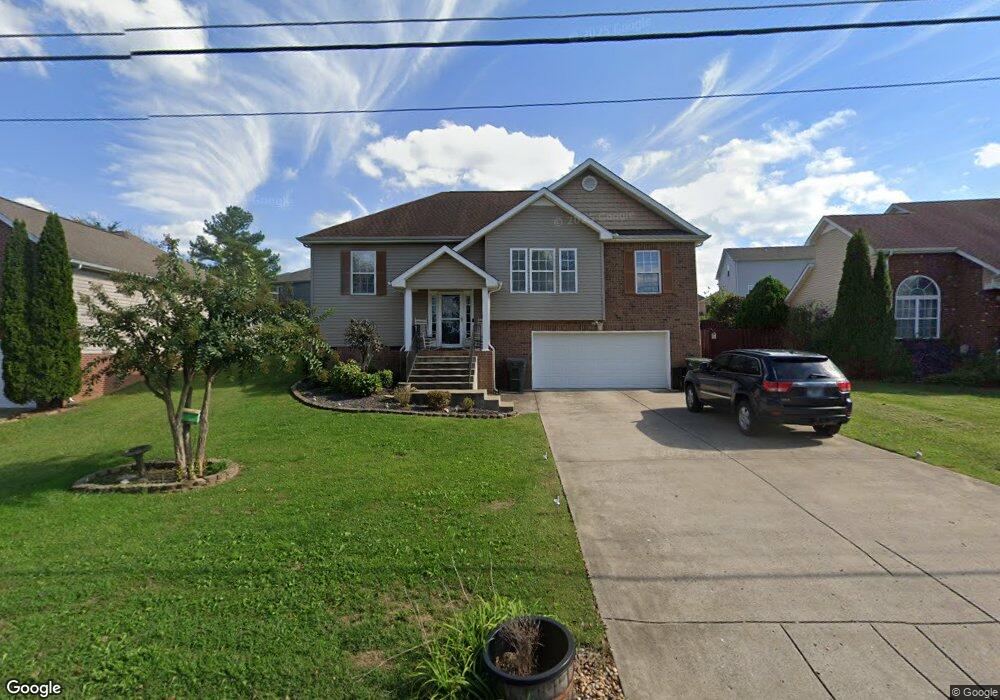
418 Berry Cir Springfield, TN 37172
Estimated Value: $280,289 - $311,000
--
Bed
2
Baths
1,416
Sq Ft
$209/Sq Ft
Est. Value
About This Home
This home is located at 418 Berry Cir, Springfield, TN 37172 and is currently estimated at $296,322, approximately $209 per square foot. 418 Berry Cir is a home located in Robertson County with nearby schools including Westside Elementary School, Cheatham Park Elementary School, and Jo Byrns High School.
Ownership History
Date
Name
Owned For
Owner Type
Purchase Details
Closed on
Jul 10, 2023
Sold by
Mitchell Karla
Bought by
Dunn Marissa
Current Estimated Value
Home Financials for this Owner
Home Financials are based on the most recent Mortgage that was taken out on this home.
Original Mortgage
$14,400
Outstanding Balance
$2,059
Interest Rate
6.57%
Mortgage Type
New Conventional
Estimated Equity
$294,263
Purchase Details
Closed on
Jun 4, 2008
Sold by
Burnett Builders Inc
Bought by
Crowell Karla J
Home Financials for this Owner
Home Financials are based on the most recent Mortgage that was taken out on this home.
Original Mortgage
$136,852
Interest Rate
6.04%
Purchase Details
Closed on
Jun 2, 2008
Sold by
Green Springfield
Bought by
Burnett Builders Inc
Home Financials for this Owner
Home Financials are based on the most recent Mortgage that was taken out on this home.
Original Mortgage
$136,852
Interest Rate
6.04%
Create a Home Valuation Report for This Property
The Home Valuation Report is an in-depth analysis detailing your home's value as well as a comparison with similar homes in the area
Home Values in the Area
Average Home Value in this Area
Purchase History
| Date | Buyer | Sale Price | Title Company |
|---|---|---|---|
| Dunn Marissa | $240,000 | None Listed On Document | |
| Dunn Marissa | $240,000 | None Listed On Document | |
| Crowell Karla J | $139,000 | -- | |
| Burnett Builders Inc | $23,000 | -- |
Source: Public Records
Mortgage History
| Date | Status | Borrower | Loan Amount |
|---|---|---|---|
| Open | Dunn Marissa | $14,400 | |
| Closed | Dunn Marissa | $14,400 | |
| Open | Dunn Marissa | $235,653 | |
| Closed | Dunn Marissa | $235,653 | |
| Previous Owner | Burnett Builders Inc | $136,852 |
Source: Public Records
Tax History Compared to Growth
Tax History
| Year | Tax Paid | Tax Assessment Tax Assessment Total Assessment is a certain percentage of the fair market value that is determined by local assessors to be the total taxable value of land and additions on the property. | Land | Improvement |
|---|---|---|---|---|
| 2024 | -- | $65,850 | $13,750 | $52,100 |
| 2023 | $1,649 | $65,850 | $13,750 | $52,100 |
| 2022 | $1,528 | $41,900 | $6,200 | $35,700 |
| 2021 | $1,528 | $41,900 | $6,200 | $35,700 |
| 2020 | $1,528 | $41,900 | $6,200 | $35,700 |
| 2019 | $45,979 | $41,900 | $6,200 | $35,700 |
| 2018 | $1,528 | $41,900 | $6,200 | $35,700 |
| 2017 | $1,539 | $35,925 | $5,500 | $30,425 |
| 2016 | $1,539 | $35,925 | $5,500 | $30,425 |
| 2015 | $1,494 | $35,925 | $5,500 | $30,425 |
| 2014 | $1,494 | $35,925 | $5,500 | $30,425 |
Source: Public Records
Map
Nearby Homes