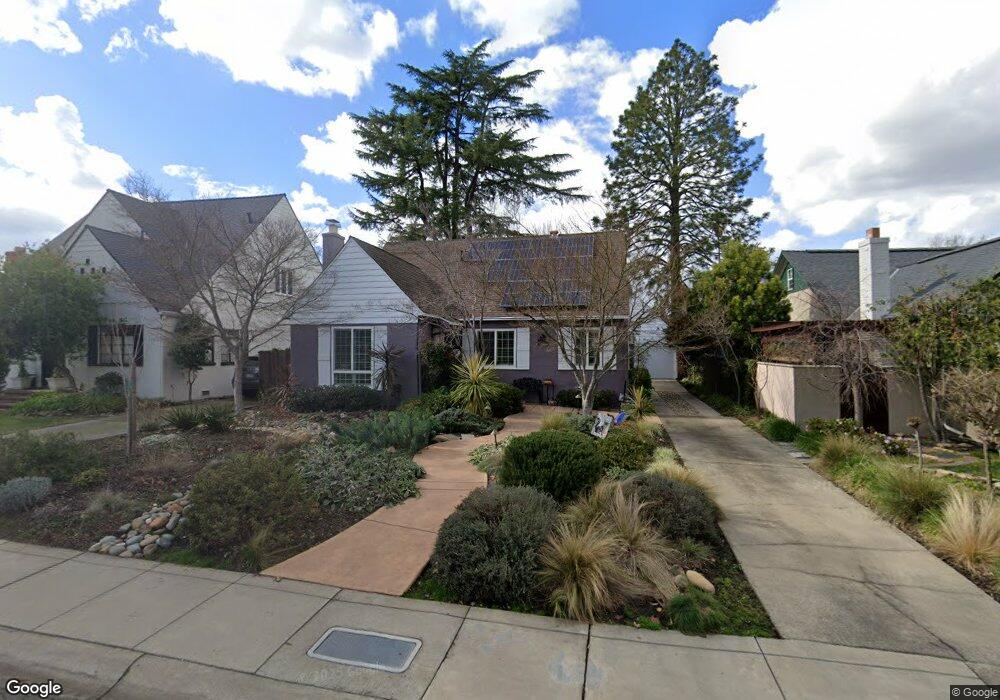
418 Coloma Way Sacramento, CA 95819
East Sacramento NeighborhoodEstimated Value: $501,000 - $754,000
2
Beds
1
Bath
1,244
Sq Ft
$534/Sq Ft
Est. Value
About This Home
This home is located at 418 Coloma Way, Sacramento, CA 95819 and is currently estimated at $664,091, approximately $533 per square foot. 418 Coloma Way is a home located in Sacramento County with nearby schools including Caleb Greenwood Elementary, Miwok Middle School, and Hiram W. Johnson High School.
Ownership History
Date
Name
Owned For
Owner Type
Purchase Details
Closed on
Jan 25, 2016
Sold by
Moore Anne H
Bought by
Moore Anne H and Anne H Moore 2016 Revocable Li
Current Estimated Value
Purchase Details
Closed on
Feb 9, 1994
Sold by
Boatman Gary Lawrence
Bought by
Moore Anne H
Home Financials for this Owner
Home Financials are based on the most recent Mortgage that was taken out on this home.
Original Mortgage
$146,800
Interest Rate
6.98%
Create a Home Valuation Report for This Property
The Home Valuation Report is an in-depth analysis detailing your home's value as well as a comparison with similar homes in the area
Home Values in the Area
Average Home Value in this Area
Purchase History
| Date | Buyer | Sale Price | Title Company |
|---|---|---|---|
| Moore Anne H | -- | None Available | |
| Moore Anne H | $183,500 | Fidelity National Title |
Source: Public Records
Mortgage History
| Date | Status | Borrower | Loan Amount |
|---|---|---|---|
| Closed | Moore Anne H | $146,800 |
Source: Public Records
Tax History Compared to Growth
Tax History
| Year | Tax Paid | Tax Assessment Tax Assessment Total Assessment is a certain percentage of the fair market value that is determined by local assessors to be the total taxable value of land and additions on the property. | Land | Improvement |
|---|---|---|---|---|
| 2025 | $3,725 | $311,856 | $124,567 | $187,289 |
| 2024 | $3,725 | $305,742 | $122,125 | $183,617 |
| 2023 | $3,636 | $299,748 | $119,731 | $180,017 |
| 2022 | $3,573 | $293,872 | $117,384 | $176,488 |
| 2021 | $3,406 | $288,111 | $115,083 | $173,028 |
| 2020 | $3,431 | $285,157 | $113,903 | $171,254 |
| 2019 | $3,358 | $279,567 | $111,670 | $167,897 |
| 2018 | $3,270 | $274,086 | $109,481 | $164,605 |
| 2017 | $3,224 | $268,713 | $107,335 | $161,378 |
| 2016 | $3,116 | $263,445 | $105,231 | $158,214 |
| 2015 | $3,069 | $259,489 | $103,651 | $155,838 |
| 2014 | $2,986 | $254,407 | $101,621 | $152,786 |
Source: Public Records
Map
Nearby Homes