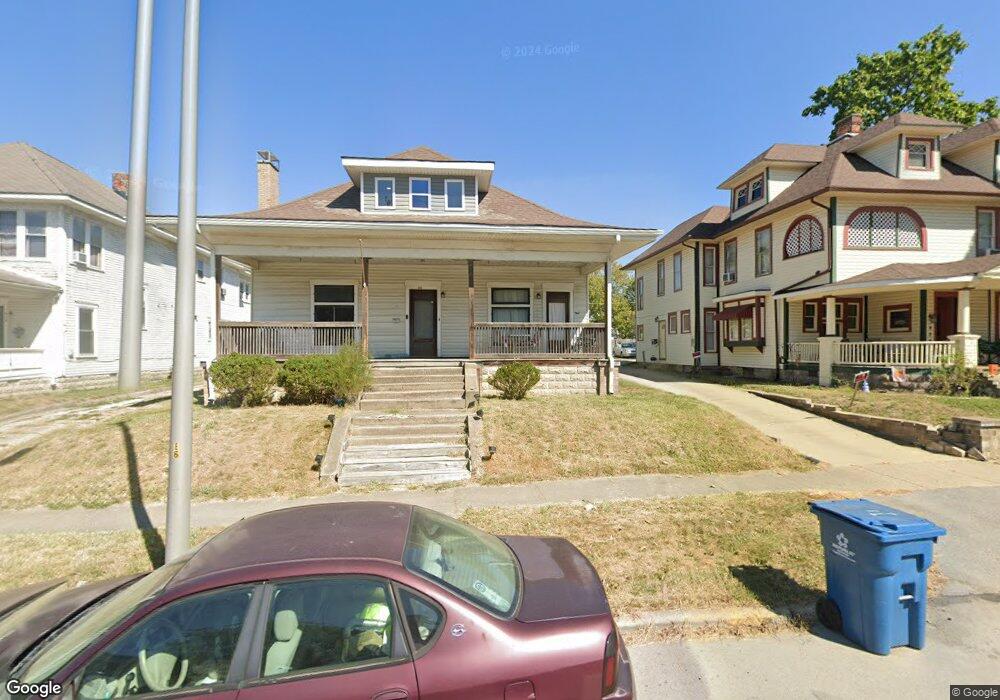
418 E Main St Greenfield, IN 46140
Estimated Value: $142,000 - $251,618
About This Home
Property Id: 751201
Recently updated 1BR/1BA, walking distance to downtown! Historical home has exterior updates starting Spring 2025. Well maintained historical home includes bathroom tile, updated lights, original hardwoods, and updated appliances Including washer and dryer. Several storage places and plenty of parking. Side and front entrance. There is central heat but no central AC, window and floor units are allowed. It is on the first floor, but there are a few steps to climb to get to the door. The best way to contact the landlord is via message on TurboTenant.
Walk throughs are scheduled after the pre-screener is completed. Please see the requirements below before filling out an application! No exceptions will be made on the requirements.
1. subject to background check/credit check (no liens/collections/past dues)
2. proof of consistent take home income at least 4x the monthly rent ($3360)
3. no prior evictions
Non-refundable pet deposit: $100/pet
Ownership History
Purchase Details
Home Financials for this Owner
Home Financials are based on the most recent Mortgage that was taken out on this home.Purchase Details
Purchase Details
Home Values in the Area
Average Home Value in this Area
Purchase History
| Date | Buyer | Sale Price | Title Company |
|---|---|---|---|
| Jared Investments Llc | $115,700 | Centurion Land Title Inc | |
| Mershon Brian | -- | None Available | |
| Firstmerit Bank | $29,750 | None Available |
Mortgage History
| Date | Status | Borrower | Loan Amount |
|---|---|---|---|
| Closed | Jared Investments Llc | $139,930 |
Property History
| Date | Event | Price | List to Sale | Price per Sq Ft |
|---|---|---|---|---|
| 01/27/2026 01/27/26 | Off Market | $860 | -- | -- |
| 11/25/2025 11/25/25 | Price Changed | $860 | 0.0% | $1 / Sq Ft |
| 11/25/2025 11/25/25 | For Rent | $860 | +2.4% | -- |
| 12/17/2024 12/17/24 | Off Market | $840 | -- | -- |
| 11/21/2024 11/21/24 | For Rent | $840 | -- | -- |
Tax History
| Year | Tax Paid | Tax Assessment Tax Assessment Total Assessment is a certain percentage of the fair market value that is determined by local assessors to be the total taxable value of land and additions on the property. | Land | Improvement |
|---|---|---|---|---|
| 2024 | $3,900 | $195,000 | $40,000 | $155,000 |
| 2023 | $3,900 | $234,200 | $40,000 | $194,200 |
| 2022 | $4,010 | $200,500 | $28,600 | $171,900 |
| 2021 | $1,132 | $56,600 | $28,600 | $28,000 |
| 2020 | $1,132 | $56,600 | $28,600 | $28,000 |
| 2019 | $1,108 | $55,400 | $28,600 | $26,800 |
| 2018 | $1,108 | $55,400 | $28,600 | $26,800 |
| 2017 | $1,096 | $54,800 | $28,600 | $26,200 |
| 2016 | $1,086 | $145,400 | $28,300 | $117,100 |
| 2014 | $1,932 | $96,600 | $27,200 | $69,400 |
| 2013 | $1,932 | $96,600 | $27,200 | $69,400 |
Map
- 614 E Main St
- 308 Baldwin St
- 0 N Sr 9 Unit MBR21970587
- 0 S State St Unit MBR22005177
- 131 Howard St
- 202 N State St
- 302 Douglas St
- 210 Douglas St
- 218 Douglas St
- 421 N State St
- 404 N State St
- 518 N State St
- 502 S State St
- 621 N State St
- 425 S Pennsylvania St
- 507 S Pennsylvania St
- 327 Shadow Creek Pass
- 342 Shadow Creek Pass
- 632 - 632 1/2 S State St
- 2815 W 400 St N
Ask me questions while you tour the home.