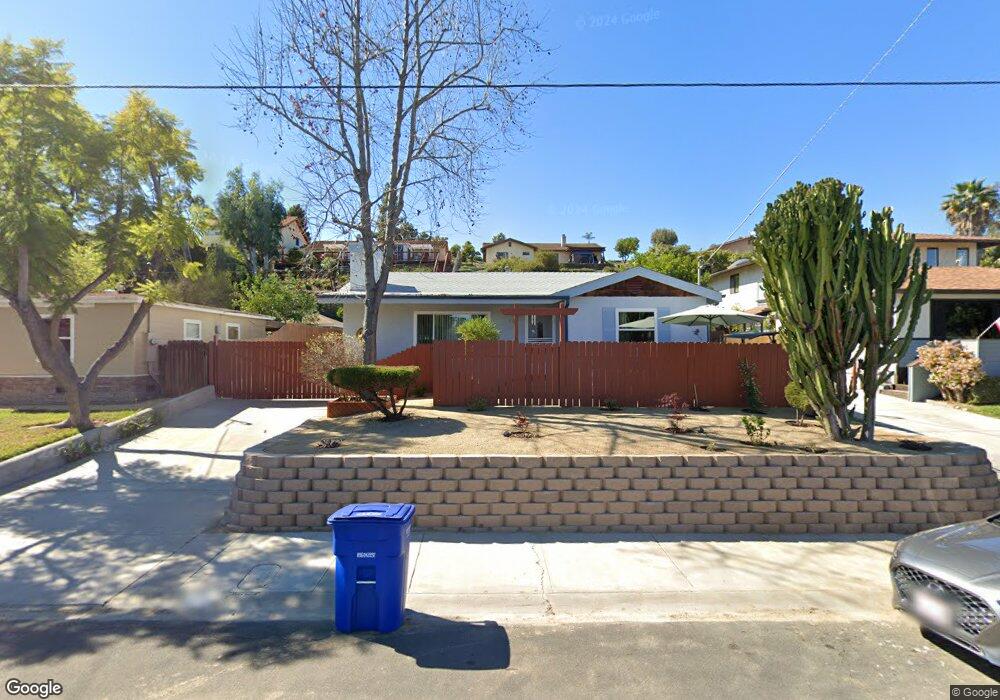
418 N Cuyamaca St El Cajon, CA 92020
Fletcher Hills NeighborhoodEstimated Value: $705,846 - $903,000
2
Beds
2
Baths
1,148
Sq Ft
$667/Sq Ft
Est. Value
About This Home
This home is located at 418 N Cuyamaca St, El Cajon, CA 92020 and is currently estimated at $765,712, approximately $666 per square foot. 418 N Cuyamaca St is a home located in San Diego County with nearby schools including Flying Hills Elementary School, Grossmont High School, and Eje Middle Academy.
Ownership History
Date
Name
Owned For
Owner Type
Purchase Details
Closed on
Nov 4, 2021
Sold by
Jones Theodore Yeates and The Theodore Yeates Jones Livi
Bought by
Jones Theodore Yeates and The Theodore Yeates Jones Livi
Current Estimated Value
Home Financials for this Owner
Home Financials are based on the most recent Mortgage that was taken out on this home.
Original Mortgage
$326,000
Outstanding Balance
$298,806
Interest Rate
3.01%
Mortgage Type
New Conventional
Estimated Equity
$466,906
Purchase Details
Closed on
Mar 14, 2017
Sold by
Jones Theodore Y
Bought by
The Theodore Yeates Jones Living Trust
Purchase Details
Closed on
May 31, 1994
Sold by
Reeder Ronald C and Reeder Jay A
Bought by
Jones Theodore Y
Home Financials for this Owner
Home Financials are based on the most recent Mortgage that was taken out on this home.
Original Mortgage
$125,400
Interest Rate
5.62%
Purchase Details
Closed on
Aug 31, 1990
Purchase Details
Closed on
Oct 21, 1988
Create a Home Valuation Report for This Property
The Home Valuation Report is an in-depth analysis detailing your home's value as well as a comparison with similar homes in the area
Home Values in the Area
Average Home Value in this Area
Purchase History
| Date | Buyer | Sale Price | Title Company |
|---|---|---|---|
| Jones Theodore Yeates | -- | Wfg National Title Company | |
| The Theodore Yeates Jones Living Trust | -- | None Available | |
| Jones Theodore Y | $129,500 | North American Title Company | |
| -- | $157,000 | -- | |
| -- | $82,000 | -- |
Source: Public Records
Mortgage History
| Date | Status | Borrower | Loan Amount |
|---|---|---|---|
| Open | Jones Theodore Yeates | $326,000 | |
| Previous Owner | Jones Theodore Y | $125,400 |
Source: Public Records
Tax History Compared to Growth
Tax History
| Year | Tax Paid | Tax Assessment Tax Assessment Total Assessment is a certain percentage of the fair market value that is determined by local assessors to be the total taxable value of land and additions on the property. | Land | Improvement |
|---|---|---|---|---|
| 2025 | $3,216 | $217,487 | $100,765 | $116,722 |
| 2024 | $3,216 | $213,224 | $98,790 | $114,434 |
| 2023 | $3,129 | $209,044 | $96,853 | $112,191 |
| 2022 | $3,193 | $204,946 | $94,954 | $109,992 |
| 2021 | $3,650 | $200,929 | $93,093 | $107,836 |
| 2020 | $3,086 | $198,870 | $92,139 | $106,731 |
| 2019 | $2,325 | $194,972 | $90,333 | $104,639 |
| 2018 | $2,286 | $191,150 | $88,562 | $102,588 |
| 2017 | $2,255 | $187,403 | $86,826 | $100,577 |
| 2016 | $2,164 | $183,729 | $85,124 | $98,605 |
| 2015 | $2,151 | $180,970 | $83,846 | $97,124 |
| 2014 | $2,109 | $177,426 | $82,204 | $95,222 |
Source: Public Records
Map
Nearby Homes
- 370 N Cuyamaca St
- 346 El Monte Rd
- 701 El Monte Rd
- 1387 Weers St
- 1280 W Main St Unit 24
- 1280 W Main St Unit 6
- 731 Dewane Dr
- 1673 Hillsmont Dr
- 741 N Pierce St
- 1681 Hillsmont Dr
- 168 S Pierce St
- 927 W Main St
- 302 Travelodge Dr
- 275 Hihill Way
- 1894 Wedgemere Rd
- 589 N Johnson Ave Unit 247
- 589 N Johnson Ave Unit 130
- 198 Croydon Ln
- 484 Gardner St
- 1958 Milford Place
- 426 N Cuyamaca St
- 410 N Cuyamaca St
- 438 N Cuyamaca St
- 402 N Cuyamaca St
- 423 Dewane Dr
- 411 Dewane Dr
- 435 Dewane Dr
- 446 N Cuyamaca St
- 417 N Cuyamaca St
- 396 N Cuyamaca St
- 405 Dewane Dr
- 425 N Cuyamaca St
- 409 N Cuyamaca St
- 447 Dewane Dr
- 437 N Cuyamaca St
- 458 N Cuyamaca St
- 401 N Cuyamaca St
- 399 Dewane Dr
- 445 N Cuyamaca St
- 382 N Cuyamaca St