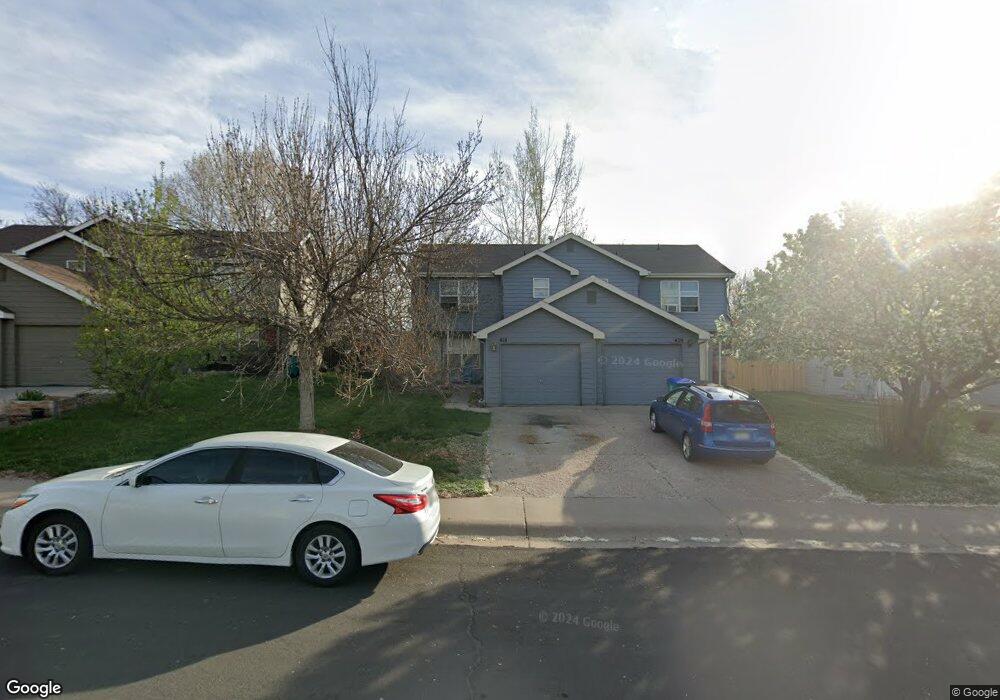
418 Sundance Cir N Fort Collins, CO 80524
Estimated Value: $322,866 - $371,000
3
Beds
3
Baths
1,298
Sq Ft
$260/Sq Ft
Est. Value
About This Home
This home is located at 418 Sundance Cir N, Fort Collins, CO 80524 and is currently estimated at $337,967, approximately $260 per square foot. 418 Sundance Cir N is a home located in Larimer County with nearby schools including Putnam Elementary School, Lincoln Middle School, and Poudre High School.
Ownership History
Date
Name
Owned For
Owner Type
Purchase Details
Closed on
Jun 14, 2024
Sold by
Faulkes Christine L
Bought by
Restoration Llc
Current Estimated Value
Purchase Details
Closed on
Jul 29, 2016
Sold by
Paterson Kathryn L
Bought by
Faulkes Christine L
Home Financials for this Owner
Home Financials are based on the most recent Mortgage that was taken out on this home.
Original Mortgage
$211,105
Interest Rate
3.75%
Mortgage Type
FHA
Purchase Details
Closed on
Dec 27, 2001
Sold by
Lewandowski Kathryn L
Bought by
Kathryn L Stenberg Family Lllp
Purchase Details
Closed on
Oct 12, 2000
Sold by
Lewandowski Henry R Kathryn L
Bought by
Lewandowski Kathryn L
Purchase Details
Closed on
Jun 2, 1997
Sold by
Finfgeld Scott
Bought by
Lewandowsk Kathryn L and Lewandowski Henry R
Create a Home Valuation Report for This Property
The Home Valuation Report is an in-depth analysis detailing your home's value as well as a comparison with similar homes in the area
Home Values in the Area
Average Home Value in this Area
Purchase History
| Date | Buyer | Sale Price | Title Company |
|---|---|---|---|
| Restoration Llc | $285,000 | Land Title | |
| Faulkes Christine L | $215,000 | Core | |
| Paterson Kathryn L | -- | Core | |
| Kathryn L Stenberg Family Lllp | -- | -- | |
| Lewandowski Kathryn L | -- | -- | |
| Lewandowsk Kathryn L | -- | -- |
Source: Public Records
Mortgage History
| Date | Status | Borrower | Loan Amount |
|---|---|---|---|
| Previous Owner | Faulkes Christine L | $211,105 |
Source: Public Records
Tax History Compared to Growth
Tax History
| Year | Tax Paid | Tax Assessment Tax Assessment Total Assessment is a certain percentage of the fair market value that is determined by local assessors to be the total taxable value of land and additions on the property. | Land | Improvement |
|---|---|---|---|---|
| 2025 | $1,900 | $23,490 | $2,345 | $21,145 |
| 2024 | $1,808 | $23,490 | $2,345 | $21,145 |
| 2022 | $1,916 | $20,295 | $2,433 | $17,862 |
| 2021 | $1,937 | $20,879 | $2,503 | $18,376 |
| 2020 | $1,654 | $17,682 | $2,503 | $15,179 |
| 2019 | $1,662 | $17,682 | $2,503 | $15,179 |
| 2018 | $1,435 | $15,746 | $2,520 | $13,226 |
| 2017 | $1,430 | $15,746 | $2,520 | $13,226 |
| 2016 | $916 | $10,030 | $2,786 | $7,244 |
| 2015 | $909 | $14,910 | $2,790 | $12,120 |
| 2014 | $1,126 | $12,340 | $2,790 | $9,550 |
Source: Public Records
Map
Nearby Homes
- 312 Butch Cassidy Dr Unit 4
- 1746 Valley View Ln
- 1812 Westview Rd
- 2112 Ford Ln
- 0 Lorraine Dr
- 936 Bramblebush St
- 1013 E Willox Ln
- 1026 Linden Gate Ct
- 624 Lupine Dr
- 938 Schlagel St Unit 7
- 820 Schlagel St Unit 5
- 919 Schlagel St Unit 1
- 919 Schlagel St Unit 3
- 919 Schlagel St Unit 2
- 919 Schlagel St Unit 8
- 919 Schlagel St Unit 5
- 919 Schlagel St Unit 7
- 919 Schlagel St Unit 6
- 332 Osiander St
- 326 Osiander St Unit C
- 420 Sundance Cir N
- 414 Sundance Cir N
- 424 Sundance Cir N
- 412 Sundance Cir N
- 1643 Bayberry Cir
- 426 Sundance Cir N
- 1637 Bayberry Cir
- 406 Sundance Cir N
- 1649 Bayberry Cir
- 430 Sundance Cir N
- 419 Sundance Cir N
- 400 Sundance Cir N
- 425 Sundance Cir N
- 401 Sundance Cir N
- 500 Mockorange Ct
- 1625 Bayberry Cir
- 501 Mockorange Ct
- 330 Sundance Cir N Unit D404
- 330 Sundance Cir N Unit C403
- 330 Sundance Cir N Unit B402