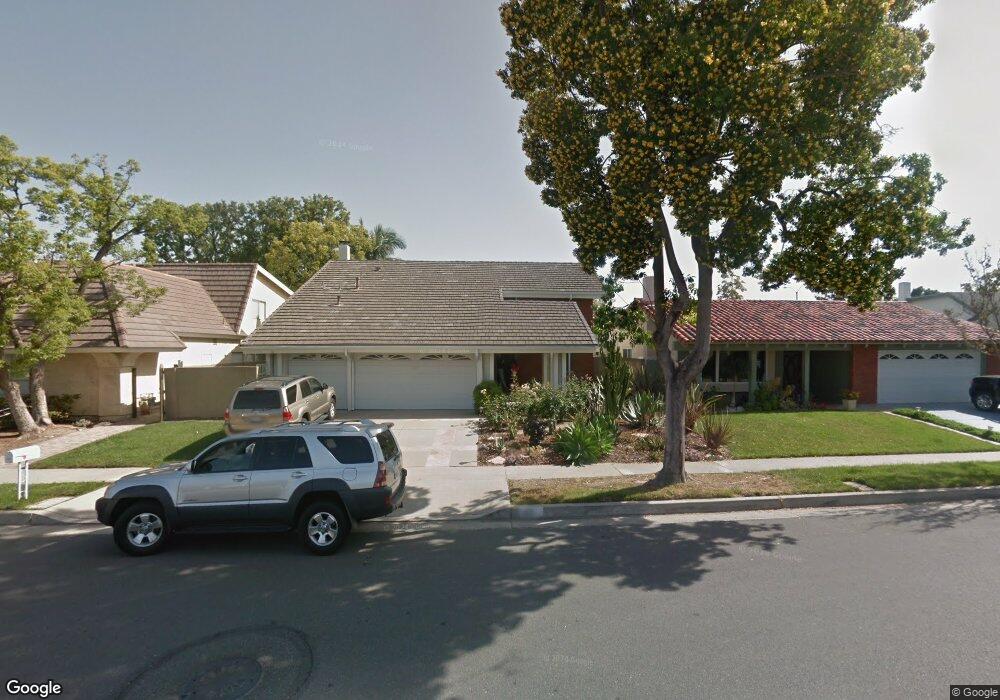
4181 Blackfin Ave Irvine, CA 92620
Northwood NeighborhoodEstimated Value: $1,713,000 - $1,839,386
4
Beds
3
Baths
2,344
Sq Ft
$764/Sq Ft
Est. Value
About This Home
This home is located at 4181 Blackfin Ave, Irvine, CA 92620 and is currently estimated at $1,790,347, approximately $763 per square foot. 4181 Blackfin Ave is a home located in Orange County with nearby schools including Brywood Elementary School, Sierra Vista Middle School, and Northwood High School.
Ownership History
Date
Name
Owned For
Owner Type
Purchase Details
Closed on
May 8, 2003
Sold by
Kozinski Marek J and Kozinska Iwona T
Bought by
Kozinski Marek and Kozinska Iwona
Current Estimated Value
Home Financials for this Owner
Home Financials are based on the most recent Mortgage that was taken out on this home.
Original Mortgage
$266,000
Interest Rate
5.71%
Mortgage Type
Purchase Money Mortgage
Purchase Details
Closed on
Apr 3, 2001
Sold by
Wilson Philip J and Wilson Cynthia E
Bought by
Kozinski Marek J and Kozinska Iwona T
Home Financials for this Owner
Home Financials are based on the most recent Mortgage that was taken out on this home.
Original Mortgage
$275,000
Interest Rate
7.03%
Purchase Details
Closed on
Jun 16, 1997
Sold by
Surrell Richard H and Surrell Susan G
Bought by
Wilson Philip J and Wilson Cynthia E
Home Financials for this Owner
Home Financials are based on the most recent Mortgage that was taken out on this home.
Original Mortgage
$215,900
Interest Rate
7.93%
Create a Home Valuation Report for This Property
The Home Valuation Report is an in-depth analysis detailing your home's value as well as a comparison with similar homes in the area
Home Values in the Area
Average Home Value in this Area
Purchase History
| Date | Buyer | Sale Price | Title Company |
|---|---|---|---|
| Kozinski Marek | -- | -- | |
| Kozinski Marek J | $415,000 | First American Title Co | |
| Wilson Philip J | $270,000 | Fidelity National Title Ins |
Source: Public Records
Mortgage History
| Date | Status | Borrower | Loan Amount |
|---|---|---|---|
| Closed | Kozinski Marek | $266,000 | |
| Closed | Kozinski Marek J | $275,000 | |
| Previous Owner | Wilson Philip J | $215,900 | |
| Closed | Kozinski Marek J | $98,500 |
Source: Public Records
Tax History
| Year | Tax Paid | Tax Assessment Tax Assessment Total Assessment is a certain percentage of the fair market value that is determined by local assessors to be the total taxable value of land and additions on the property. | Land | Improvement |
|---|---|---|---|---|
| 2025 | $6,564 | $625,330 | $444,003 | $181,327 |
| 2024 | $6,564 | $613,069 | $435,297 | $177,772 |
| 2023 | $6,395 | $601,049 | $426,762 | $174,287 |
| 2022 | $6,272 | $589,264 | $418,394 | $170,870 |
| 2021 | $6,128 | $577,710 | $410,190 | $167,520 |
| 2020 | $6,094 | $571,787 | $405,984 | $165,803 |
| 2019 | $5,959 | $560,576 | $398,024 | $162,552 |
| 2018 | $5,854 | $549,585 | $390,220 | $159,365 |
| 2017 | $5,734 | $538,809 | $382,568 | $156,241 |
| 2016 | $5,481 | $528,245 | $375,067 | $153,178 |
| 2015 | $5,400 | $520,311 | $369,433 | $150,878 |
| 2014 | $5,296 | $510,119 | $362,196 | $147,923 |
Source: Public Records
Map
Nearby Homes
- 4191 Blackfin Ave
- 4161 Blackfin Ave
- 4201 Blackfin Ave
- 13552 Jemel Way
- 4151 Blackfin Ave
- 4172 Blackfin Ave
- 4211 Blackfin Ave
- 4156 Blackfin Ave
- 13562 Jemel Way
- 6 Bunker Hill
- 13551 Onkayha Cir
- 8 Bunker Hill
- 4 Bunker Hill
- 4221 Blackfin Ave
- 4142 Blackfin Ave
- 10 Bunker Hill
- 2 Bunker Hill
- 13561 Onkayha Cir
- 4171 Salacia Dr
- 12 Bunker Hill
Your Personal Tour Guide
Ask me questions while you tour the home.