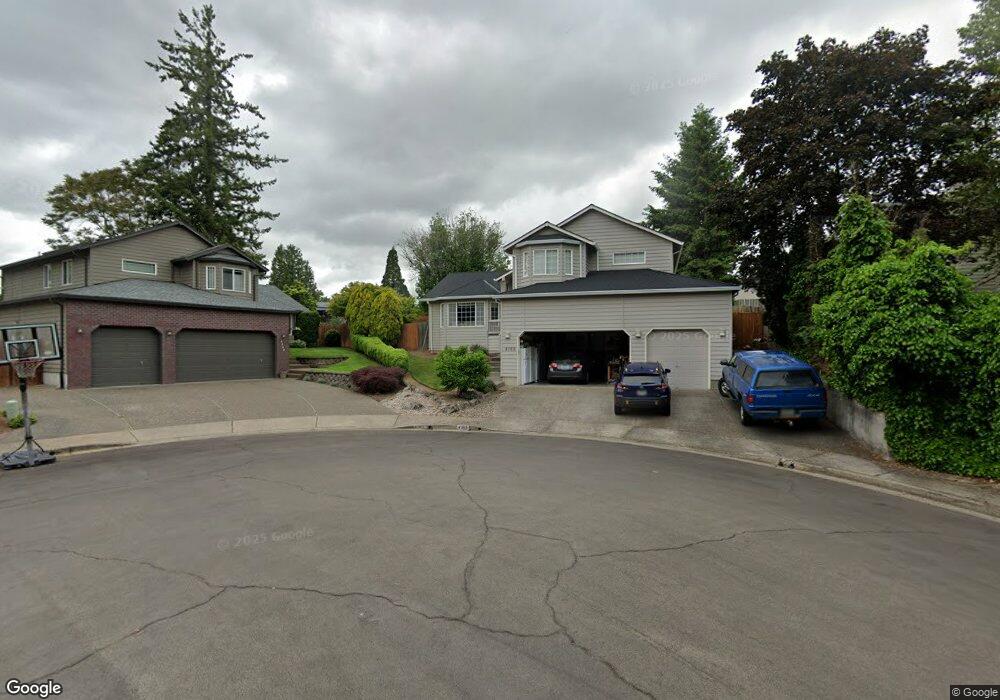
4183 SE 2nd Terrace Gresham, OR 97080
Powell Valley NeighborhoodEstimated Value: $544,000 - $633,000
4
Beds
3
Baths
2,047
Sq Ft
$281/Sq Ft
Est. Value
About This Home
This home is located at 4183 SE 2nd Terrace, Gresham, OR 97080 and is currently estimated at $574,867, approximately $280 per square foot. 4183 SE 2nd Terrace is a home located in Multnomah County with nearby schools including Powell Valley Elementary School, Gordon Russell Middle School, and Sam Barlow High School.
Ownership History
Date
Name
Owned For
Owner Type
Purchase Details
Closed on
Oct 14, 2004
Sold by
Hampton Travis L
Bought by
Jones Scott T and Jones Diane M
Current Estimated Value
Home Financials for this Owner
Home Financials are based on the most recent Mortgage that was taken out on this home.
Original Mortgage
$156,450
Outstanding Balance
$76,680
Interest Rate
5.72%
Mortgage Type
Purchase Money Mortgage
Estimated Equity
$498,187
Purchase Details
Closed on
Sep 25, 1997
Sold by
Gentry Development Company Inc
Bought by
Hampton Travis L and Hampton Belinda Jo
Home Financials for this Owner
Home Financials are based on the most recent Mortgage that was taken out on this home.
Original Mortgage
$151,900
Interest Rate
7.54%
Mortgage Type
Purchase Money Mortgage
Purchase Details
Closed on
Jul 11, 1996
Sold by
B I Gentry Construction Co Inc
Bought by
Gentry Development Company Inc
Create a Home Valuation Report for This Property
The Home Valuation Report is an in-depth analysis detailing your home's value as well as a comparison with similar homes in the area
Home Values in the Area
Average Home Value in this Area
Purchase History
| Date | Buyer | Sale Price | Title Company |
|---|---|---|---|
| Jones Scott T | $269,950 | Fidelity Natl Title Co Of Or | |
| Hampton Travis L | $189,900 | Oregon Title Insurance Co | |
| Gentry Development Company Inc | $37,000 | Oregon Title Insurance Co |
Source: Public Records
Mortgage History
| Date | Status | Borrower | Loan Amount |
|---|---|---|---|
| Open | Jones Scott T | $156,450 | |
| Previous Owner | Hampton Travis L | $151,900 | |
| Closed | Jones Scott T | $100,000 |
Source: Public Records
Tax History
| Year | Tax Paid | Tax Assessment Tax Assessment Total Assessment is a certain percentage of the fair market value that is determined by local assessors to be the total taxable value of land and additions on the property. | Land | Improvement |
|---|---|---|---|---|
| 2025 | $6,413 | $315,130 | -- | -- |
| 2024 | $6,139 | $305,960 | -- | -- |
| 2023 | $5,593 | $297,050 | $0 | $0 |
| 2022 | $5,436 | $288,400 | $0 | $0 |
| 2021 | $5,299 | $280,000 | $0 | $0 |
| 2020 | $4,986 | $271,850 | $0 | $0 |
| 2019 | $4,856 | $263,940 | $0 | $0 |
| 2018 | $4,630 | $256,260 | $0 | $0 |
| 2017 | $4,442 | $248,800 | $0 | $0 |
| 2016 | $3,917 | $241,560 | $0 | $0 |
Source: Public Records
Map
Nearby Homes
- 4396 SE 1st Terrace
- 4343 NE 1st St
- 150 NE Greenway Dr
- 377 SE Barnes Ave
- 64 NE Scott Dr
- 4545 SE 3rd St
- 191 SE Acacia Dr
- 195 SE Acacia Dr
- 289 SE Acacia Dr
- 4111 NE 3rd St
- 295 SE Baker Ave
- 3825 NE 2nd St
- 3545 SE 1st St
- 275 NE Scott Dr
- 800 SE Greenway Dr
- 499 NE Williams Rd
- 205 SE Olvera Ave
- 0 SE Powell Valley Rd Unit 257585008
- 4668 SE 2nd St
- 180 NE Kane Dr Unit 180
- 4163 SE 2nd Terrace
- 127 SE Greenway Ln
- 167 SE Greenway Ln
- 4140 SE El Camino Dr
- 107 SE Greenway Ln
- 4120 SE El Camino Dr
- 4164 SE 2nd Terrace
- 4184 SE 2nd Terrace
- 4110 SE El Camino Dr
- 4150 NE El Camino Dr
- 9 NE Greenway Dr
- 4090 SE El Camino Dr
- 158 SE Greenway Ln
- 108 SE Greenway Ln
- 65 NE Greenway Dr
- 4160 NE El Camino Dr
- 4215 SE 1st Terrace
- 4101 SE El Camino Dr
- 4060 SE El Camino Dr
- 4224 SE 2nd Terrace
Your Personal Tour Guide
Ask me questions while you tour the home.