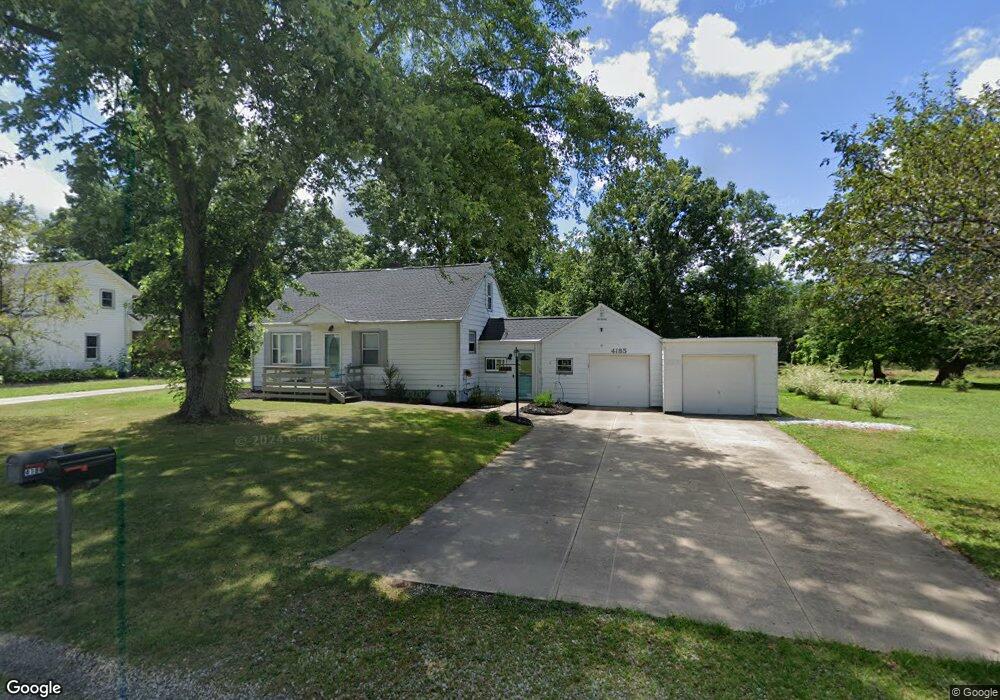
4185 Rock Spring Rd Ravenna, OH 44266
Estimated Value: $182,000 - $190,000
2
Beds
1
Bath
768
Sq Ft
$243/Sq Ft
Est. Value
About This Home
This home is located at 4185 Rock Spring Rd, Ravenna, OH 44266 and is currently estimated at $186,273, approximately $242 per square foot. 4185 Rock Spring Rd is a home located in Portage County with nearby schools including Southeast High School.
Ownership History
Date
Name
Owned For
Owner Type
Purchase Details
Closed on
Jul 28, 2010
Sold by
Falkowski Judy and Seeley Judith D
Bought by
Caruthers Matthew A
Current Estimated Value
Home Financials for this Owner
Home Financials are based on the most recent Mortgage that was taken out on this home.
Original Mortgage
$81,897
Outstanding Balance
$54,876
Interest Rate
4.81%
Mortgage Type
FHA
Estimated Equity
$131,397
Purchase Details
Closed on
Jul 23, 2008
Sold by
Mundy David
Bought by
Falkowski Judy and Secley Judith D
Purchase Details
Closed on
Nov 8, 2005
Sold by
Seeley Judith D and Falkowski Judy
Bought by
Seely Judith D and Mundy David
Purchase Details
Closed on
Jul 16, 2004
Sold by
Seeley Ivanette V
Bought by
Falkowski Judy
Purchase Details
Closed on
Dec 9, 1988
Bought by
Seeley Ivanette
Create a Home Valuation Report for This Property
The Home Valuation Report is an in-depth analysis detailing your home's value as well as a comparison with similar homes in the area
Home Values in the Area
Average Home Value in this Area
Purchase History
| Date | Buyer | Sale Price | Title Company |
|---|---|---|---|
| Caruthers Matthew A | $83,000 | Bennett Land Title Agency | |
| Falkowski Judy | -- | None Available | |
| Seely Judith D | -- | -- | |
| Falkowski Judy | -- | -- | |
| Seeley Ivanette | -- | -- |
Source: Public Records
Mortgage History
| Date | Status | Borrower | Loan Amount |
|---|---|---|---|
| Open | Caruthers Matthew A | $81,897 |
Source: Public Records
Tax History Compared to Growth
Tax History
| Year | Tax Paid | Tax Assessment Tax Assessment Total Assessment is a certain percentage of the fair market value that is determined by local assessors to be the total taxable value of land and additions on the property. | Land | Improvement |
|---|---|---|---|---|
| 2024 | $1,635 | $45,010 | $6,580 | $38,430 |
| 2023 | $1,392 | $34,310 | $5,710 | $28,600 |
| 2022 | $1,444 | $34,310 | $5,710 | $28,600 |
| 2021 | $1,456 | $34,310 | $5,710 | $28,600 |
| 2020 | $1,308 | $29,610 | $5,180 | $24,430 |
| 2019 | $1,311 | $29,610 | $5,180 | $24,430 |
| 2018 | $1,354 | $28,850 | $5,010 | $23,840 |
| 2017 | $1,354 | $28,850 | $5,010 | $23,840 |
| 2016 | $1,349 | $28,850 | $5,010 | $23,840 |
| 2015 | $1,291 | $28,850 | $5,010 | $23,840 |
| 2014 | $1,410 | $27,480 | $5,010 | $22,470 |
| 2013 | $1,227 | $27,480 | $5,010 | $22,470 |
Source: Public Records
Map
Nearby Homes
- 3798 State Route 183
- V/L St Andrews Way
- 7392 Tallmadge Rd
- 0 St Andrews Way Unit 5094250
- 6747 Giddings Rd
- 7939 Giddings Rd
- 3807 Industry Rd
- 2880 State Route 14
- 5387 State Route 14
- 0 John Thomas
- 6605 State Route 5
- 5560 Wilkes Rd
- 0 New Milford Rd Unit 11489599
- 0 New Milford Rd Unit 5108183
- 3987 J A Vaughn Ave
- 2547 Industry Rd
- 6720 Newton Falls Rd
- 5659 State Route 14
- 2171 Alliance Rd
- 4691 Scenic Dr
- 4195 Rock Spring Rd
- 4173 Rock Spring Rd
- 4209 Rock Spring Rd
- 4184 Rock Spring Rd
- 4194 Rock Spring Rd
- 4219 Rock Spring Rd
- 4154 Rock Spring Rd
- 4227 Rock Spring Rd
- 4227 Rock Spring Rd Unit 25
- 4142 Rock Spring Rd
- 4155 Rock Spring Rd
- 4222 Rock Spring Rd
- 4237 Rock Spring Rd
- 4134 Rock Spring Rd
- 4232 Rock Spring Rd
- 4125 Rock Spring Rd
- 4242 Rock Spring Rd
- 4257 Rock Spring Rd
- 4252 Rock Spring Rd
- 4107 Rock Spring Rd